

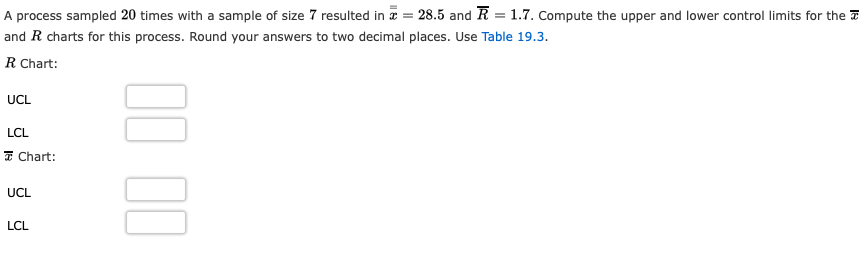
Question: A process sampled 20 times with a sample of size 7 resulted in x=28.5 and R=1.7. Compute the upper and lower control limits for the
Step by Step Solution
There are 3 Steps involved in it
1 Expert Approved Answer
Step: 1 Unlock

Question Has Been Solved by an Expert!
Get step-by-step solutions from verified subject matter experts
Step: 2 Unlock
Step: 3 Unlock