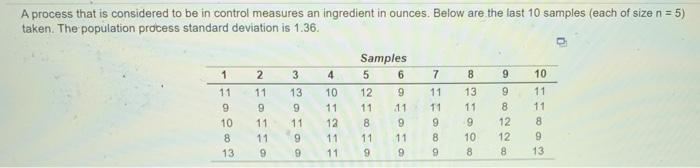
Question: A process that is considered to be in control measures an ingredient in ounces. Below are the last 10 samples (each of size n =

A process that is considered to be in control
A process that is considered to be in control measures an ingredient in ounces. Below are the last 10 samples (each of size n = 5) taken. The population process standard deviation is 1.36. 8 9 1 11 9 10 8 13 7 11 11 2 11 9 11 11 9 3 13 9 11 9 9 Samples 5 6 12 9 11 11 8 9 11 11 9 9 4 10 11 12 11 11 13 11 9 10 8 9 8 9 10 11 11 8 9 13 9 8 12 12 8 a) Standard deviation of the sampling means = ounces (round your response to three decimal places) b) With z = 3, the control limits for the mean chart are: UCL = ounces (round your response to three decimal places). LCL-ounces (round your response to three decimal places). c) The control limits for the R-chart are: UCL2= ounces (round your response to three decimal places), c) The control limits for the R-chart are UCLR = ounces (round your response to three decimal places). LCLR = ounces (round your response to three decimal places) d) Based on the x.chart, is one or more samples beyond the controllimits? Based on the R.chart, is one or more samplos beyond the control limits

Step by Step Solution

There are 3 Steps involved in it

1 Expert Approved Answer
Step: 1 Unlock blur-text-image
Question Has Been Solved by an Expert!

Get step-by-step solutions from verified subject matter experts

Step: 2 Unlock
Step: 3 Unlock

Students Have Also Explored These Related General Management Questions!