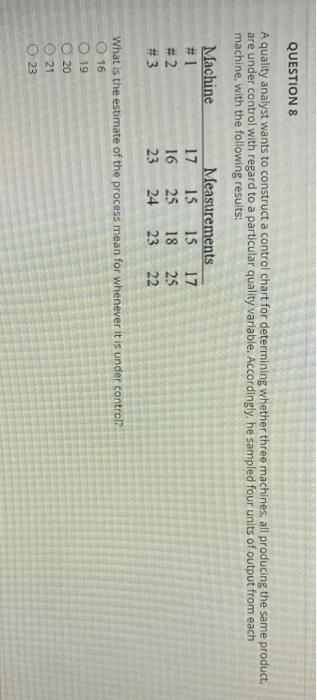
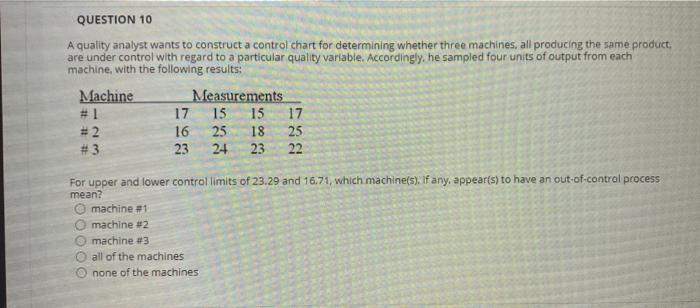
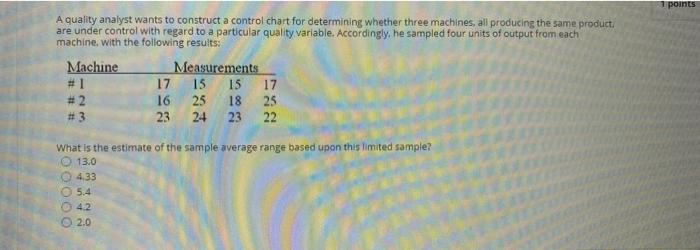
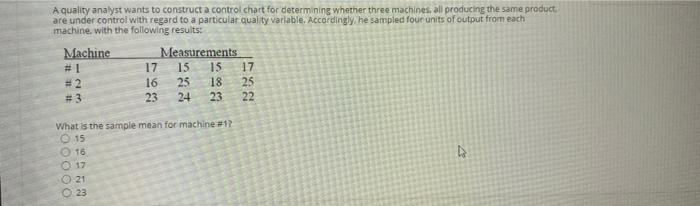
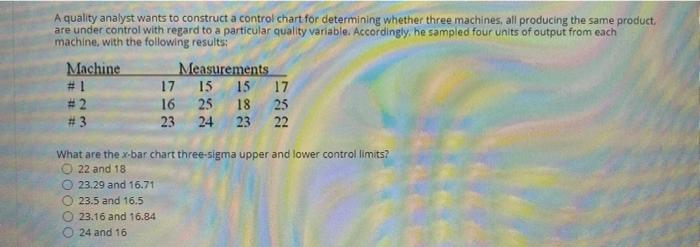
Question: QUESTIONS A quality analyst wants to construct a control chart for determining whether three machines, all producing the same product. are under control with regard

QUESTIONS A quality analyst wants to construct a
QUESTIONS A quality analyst wants to construct a control chart for determining whether three machines, all producing the same product. are under control with regard to a particular quality variable. Accordingly, he sampled four units of output from each machine with the following results: Machine Measurements # 1 17 15 15 17 #2 16 25 18 25 #3 23 24 23 22 What is the estimate of the process mean for whenever it is under control O 16 OOOOO 19 20 21 23 QUESTION 10 A quality analyst wants to construct a control chart for determining whether three machines, all producing the same product, are under control with regard to a particular quality variable. Accordingly, he sampled four units of output from each machine, with the following results: Machine Measurements # 1 17 15 15 17 #2 16 25 18 25 # 3 23 24 23 22 | For upper and lower control limits of 23-29 and 16.71, which machine(s)If any, appear(s) to have an out-of-control process mean? machine #1 machine #2 machine #3 all of the machines none of the machines >O points A quality analyst wants to construct a control chart for determining whether three machines, all producing the same product are under control with regard to a particular quality variable. Accordingly, he sampled four units of output from each machine, with the following results: Machine Measurements #1 17 15 15 17 # 2 16 25 18 25 #3 23 24 23 22 What is the estimate of the sample average range based upon this limited sample? 13.0 4.33 5.4 42 2.0 A quality analyst wants to constructa control chart for determining whether three machines, all producing the same product are under control with regard to a particular quality variable. Accordingly, he sampled four units of output from each machine with the following results Machine Measurements # 17 15 15 17 # 2 16 25 18 25 #3 23 24 23 22 What is the sample mean for machine 17 15 16 17 21 23 OOOOO A quality analyst wants to construct a control chart for determining whether three machines, all producing the same product are under control with regard to a particular quality variable. Accordingly, he sampled four units of output from each machine, with the following results: Machine Measurements #1 17 15 15 17 #2 16 25 18 25 #3 23 24 23 22 What are the x-bar chart three-sigma upper and lower control limits? 22 and 18 23.29 and 16.71 23.5 and 16.5 23.16 and 16.84 24 and 16

Step by Step Solution

There are 3 Steps involved in it

1 Expert Approved Answer
Step: 1 Unlock blur-text-image
Question Has Been Solved by an Expert!

Get step-by-step solutions from verified subject matter experts

Step: 2 Unlock
Step: 3 Unlock

Students Have Also Explored These Related General Management Questions!