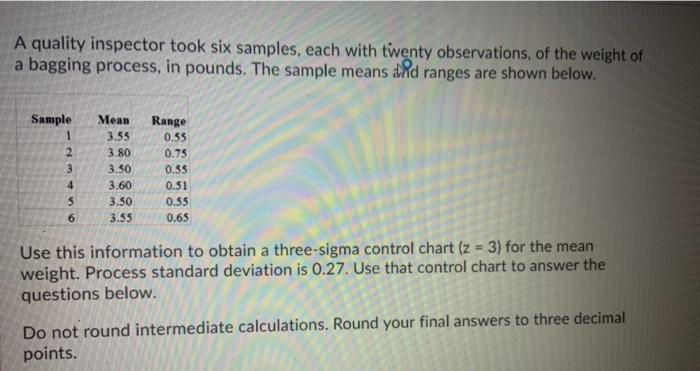
Question: A quality inspector took six samples, each with twenty observations, of the weight of a bagging process, in pounds. The sample means did ranges are

A quality inspector took six samples, each with
A quality inspector took six samples, each with twenty observations, of the weight of a bagging process, in pounds. The sample means did ranges are shown below. Sample 2 3 4 5 6 Mean 3.55 3.80 3.50 3.60 3.50 3.55 Range 0.55 0.75 0.55 0.51 0.55 0.65 Use this information to obtain a three-sigma control chart (z = 3) for the mean weight. Process standard deviation is 0.27. Use that control chart to answer the questions below. Do not round intermediate calculations. Round your final answers to three decimal points. Question 3 (2.5 points) Listen What is the upper control limit? Your Answer: Answer Question 4 (2.5 points) Listen What is the center line? Your Answer: Answer Question 5 (2.5 points) Listen What is the lower control limit? Your Answer: Answer Question 6 (0.5 points) Saved Listen Sample 1 is out of control. True False Saved Question 7 (0.5 points) listen Question 7 (0.5 points) Saved Listen Sample 2 is out of control. True False Question 8 (0.5 points) Saved Listen Sample 3 is out of control. True False Saved Question 9 (0.5 points) Listen Sample 4 is out of control. True Saved Question 9 (0.5 points) Listen Sample 4 is out of control. True False Saved Question 10 (0.5 points) Listen Sample 5 is out of control. True False Saved Question 11 (0.5 points) Listen Sample 6 is out of control. True False

Step by Step Solution

There are 3 Steps involved in it

1 Expert Approved Answer
Step: 1 Unlock blur-text-image
Question Has Been Solved by an Expert!

Get step-by-step solutions from verified subject matter experts

Step: 2 Unlock
Step: 3 Unlock

Students Have Also Explored These Related General Management Questions!