

Question: asks for 1. Upper control limit 2. Center line 3. lower control limit T/F Sample 1 is out of control Sample 2 is out of
asks for
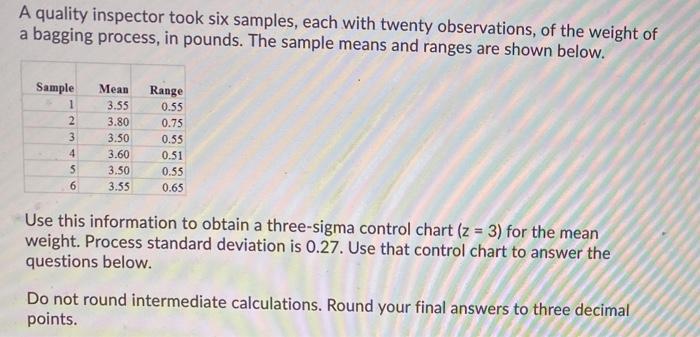
1. Upper control limit
2. Center line
3. lower control limit
T/F
Sample 1 is out of control
Sample 2 is out of control
Sample 3 is out of control
Sample 4 is out of control
Sample 5 is out of control
Sample 6 is out of control
Step by Step Solution
There are 3 Steps involved in it
1 Expert Approved Answer
Step: 1 Unlock

Question Has Been Solved by an Expert!
Get step-by-step solutions from verified subject matter experts
Step: 2 Unlock
Step: 3 Unlock