

Question: The following data represent the results from an independent-measures study comparing two treatment conditions. F-ratio: p-value: Treatment One t-statistic: 6.7 5.9 5.5 7.4 6.5
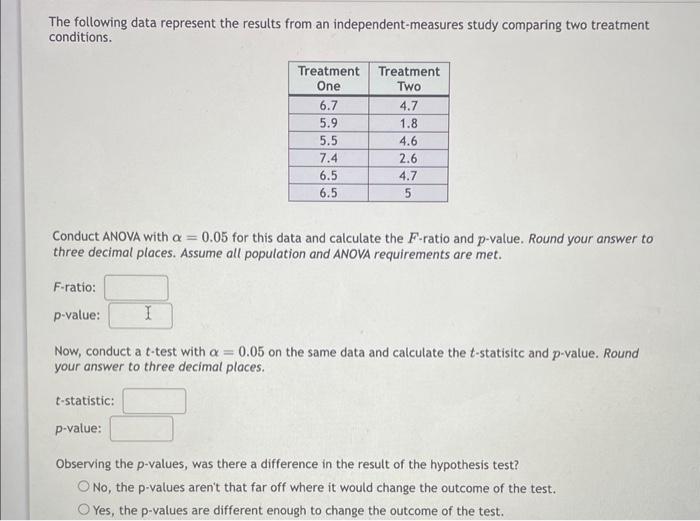
The following data represent the results from an independent-measures study comparing two treatment conditions. F-ratio: p-value: Treatment One t-statistic: 6.7 5.9 5.5 7.4 6.5 6.5 Conduct ANOVA with a = 0.05 for this data and calculate the F-ratio and p-value. Round your answer to three decimal places. Assume all population and ANOVA requirements are met. p-value: Treatment Two 4.7 1.8 4.6 2.6 4.7 5 I Now, conduct a t-test with a = 0.05 on the same data and calculate the t-statisitc and p-value. Round your answer to three decimal places. Observing the p-values, was there a difference in the result of the hypothesis test? O NO, the p-values aren't that far off where it would change the outcome of the test. OYes, the p-values are different enough to change the outcome of the test.
Step by Step Solution
3.67 Rating (165 Votes )
There are 3 Steps involved in it
To conduct the ANOVA and ttest we first need to organize the data and calculate the necessary statis... View full answer

Get step-by-step solutions from verified subject matter experts