

Question: A ratio means nothing unless it can be compared to something. Is a sales growth of 5% good or bad? If every other company in
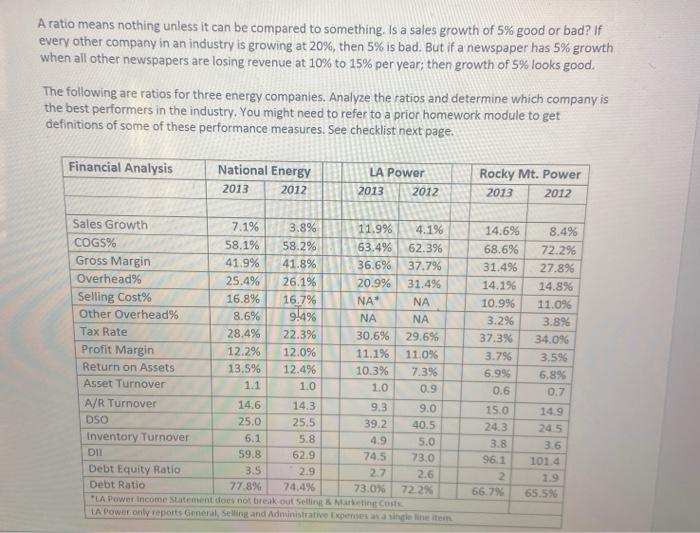
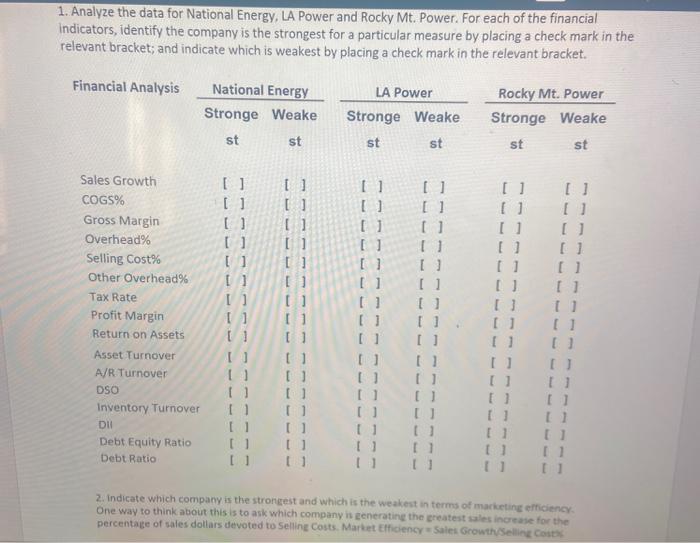
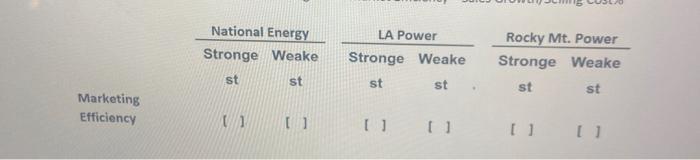
A ratio means nothing unless it can be compared to something. Is a sales growth of 5% good or bad? If every other company in an industry is growing at 20%, then 5% is bad. But if a newspaper has 5% growth when all other newspapers are losing revenue at 10% to 15% per year; then growth of 5% looks good. The following are ratios for three energy companies. Analyze the ratios and determine which company is the best performers in the industry. You might need to refer to a prior homework module to get definitions of some of these performance measures. See checklist next page. Financial Analysis National Energy 2013 2012 LA Power 2013 2012 Rocky Mt. Power 2013 2012 Sales Growth 7.1% 3.8% 11.9% 4.1% COGS% 58.1% 58.2% 63.4% 62.396 Gross Margin 41.9% 41.8% 36.6% 37.796 Overhead% 25.4% 26.1% 20.9% 31.4% Selling Cost% 16.8% 16.7% NA" . Other Overhead% 8.6% 9.4% NA NA Tax Rate 28.4% 22.3% 30.6% 29.6% Profit Margin 12.2% 12.0% 11.1% 11.0% Return on Assets 13.5% 12.4% 10.3% 7.396 Asset Turnover 1.1 1.0 0.9 A/R Turnover 14.6 14.3 9.3 9.0 DSO 25.0 25.5 39.2 40.5 Inventory Turnover 6.1 5.8 4.9 5.0 DIL 59.8 62.9 74.5 73.0 Debt Equity Ratio 3.5 2.9 2.7 2.6 Debt Ratio 77.8% 24.4% 73.0% 72.2% LA Power Income Statement does not break out Selling & Marketing Cost LA Power only reports Gmeral, Selling and Administrative penes single linee 14.6% 8. 68.6% 72.2% 31.4% 27.896 14.1% 14.8% 10.996 11.096 3.296 3.896 37.3% 34.096 3.796 3.596 6.996 6.8% 0.6 0.7 15.0 14.9 24.3 24 5 3.8 3.6 96.1 101.4 2 1.9 66.79 65.536 1.0 1. Analyze the data for National Energy, LA Power and Rocky Mt. Power. For each of the financial Indicators, identify the company is the strongest for a particular measure by placing a check mark in the relevant bracket; and indicate which is weakest by placing a check mark in the relevant bracket. Financial Analysis National Energy Stronge Weake st st LA Power Stronge Weake st st Rocky Mt. Power Stronge Weake st st [] [ 11 [] U ( U I [] [] [] 11 U [] [] U [] [] U [] [] [1 [] [] Sales Growth COGS% Gross Margin Overhead% Selling Cost% Other Overhead% Tax Rate Profit Margin Return on Assets Asset Turnover A/R Turnover DSO Inventory Turnover DI Debt Equity Ratio Debt Ratio U] 0 [1 U 11 [] Il [] U1 U 0 1 11 D] U 11 U 11 U U1 11 U U U U 11 1 1 D] 11 2. indicate which company is the strongest and which is the weakest in terms of marketing efficiency One way to think about this is to ask which company is generating the greatest sales increase for the percentage of sales dollars devoted to Selling Costs Market Eficiency Sales Growth/Selling costs LA Power National Energy Stronge Weake Stronge Weake Rocky Mt. Power Stronge Weake st st st st st st Marketing Efficiency [] U [] [] A ratio means nothing unless it can be compared to something. Is a sales growth of 5% good or bad? If every other company in an industry is growing at 20%, then 5% is bad. But if a newspaper has 5% growth when all other newspapers are losing revenue at 10% to 15% per year; then growth of 5% looks good. The following are ratios for three energy companies. Analyze the ratios and determine which company is the best performers in the industry. You might need to refer to a prior homework module to get definitions of some of these performance measures. See checklist next page. Financial Analysis National Energy 2013 2012 LA Power 2013 2012 Rocky Mt. Power 2013 2012 Sales Growth 7.1% 3.8% 11.9% 4.1% COGS% 58.1% 58.2% 63.4% 62.396 Gross Margin 41.9% 41.8% 36.6% 37.796 Overhead% 25.4% 26.1% 20.9% 31.4% Selling Cost% 16.8% 16.7% NA" . Other Overhead% 8.6% 9.4% NA NA Tax Rate 28.4% 22.3% 30.6% 29.6% Profit Margin 12.2% 12.0% 11.1% 11.0% Return on Assets 13.5% 12.4% 10.3% 7.396 Asset Turnover 1.1 1.0 0.9 A/R Turnover 14.6 14.3 9.3 9.0 DSO 25.0 25.5 39.2 40.5 Inventory Turnover 6.1 5.8 4.9 5.0 DIL 59.8 62.9 74.5 73.0 Debt Equity Ratio 3.5 2.9 2.7 2.6 Debt Ratio 77.8% 24.4% 73.0% 72.2% LA Power Income Statement does not break out Selling & Marketing Cost LA Power only reports Gmeral, Selling and Administrative penes single linee 14.6% 8. 68.6% 72.2% 31.4% 27.896 14.1% 14.8% 10.996 11.096 3.296 3.896 37.3% 34.096 3.796 3.596 6.996 6.8% 0.6 0.7 15.0 14.9 24.3 24 5 3.8 3.6 96.1 101.4 2 1.9 66.79 65.536 1.0 1. Analyze the data for National Energy, LA Power and Rocky Mt. Power. For each of the financial Indicators, identify the company is the strongest for a particular measure by placing a check mark in the relevant bracket; and indicate which is weakest by placing a check mark in the relevant bracket. Financial Analysis National Energy Stronge Weake st st LA Power Stronge Weake st st Rocky Mt. Power Stronge Weake st st [] [ 11 [] U ( U I [] [] [] 11 U [] [] U [] [] U [] [] [1 [] [] Sales Growth COGS% Gross Margin Overhead% Selling Cost% Other Overhead% Tax Rate Profit Margin Return on Assets Asset Turnover A/R Turnover DSO Inventory Turnover DI Debt Equity Ratio Debt Ratio U] 0 [1 U 11 [] Il [] U1 U 0 1 11 D] U 11 U 11 U U1 11 U U U U 11 1 1 D] 11 2. indicate which company is the strongest and which is the weakest in terms of marketing efficiency One way to think about this is to ask which company is generating the greatest sales increase for the percentage of sales dollars devoted to Selling Costs Market Eficiency Sales Growth/Selling costs LA Power National Energy Stronge Weake Stronge Weake Rocky Mt. Power Stronge Weake st st st st st st Marketing Efficiency [] U [] []
Step by Step Solution
There are 3 Steps involved in it

Get step-by-step solutions from verified subject matter experts