

Question: A recent study found that American consumers are making average monthly debt Dallas 68 3 8.4 970 payments of around $1,000 (Source: Experian.com, November 11,
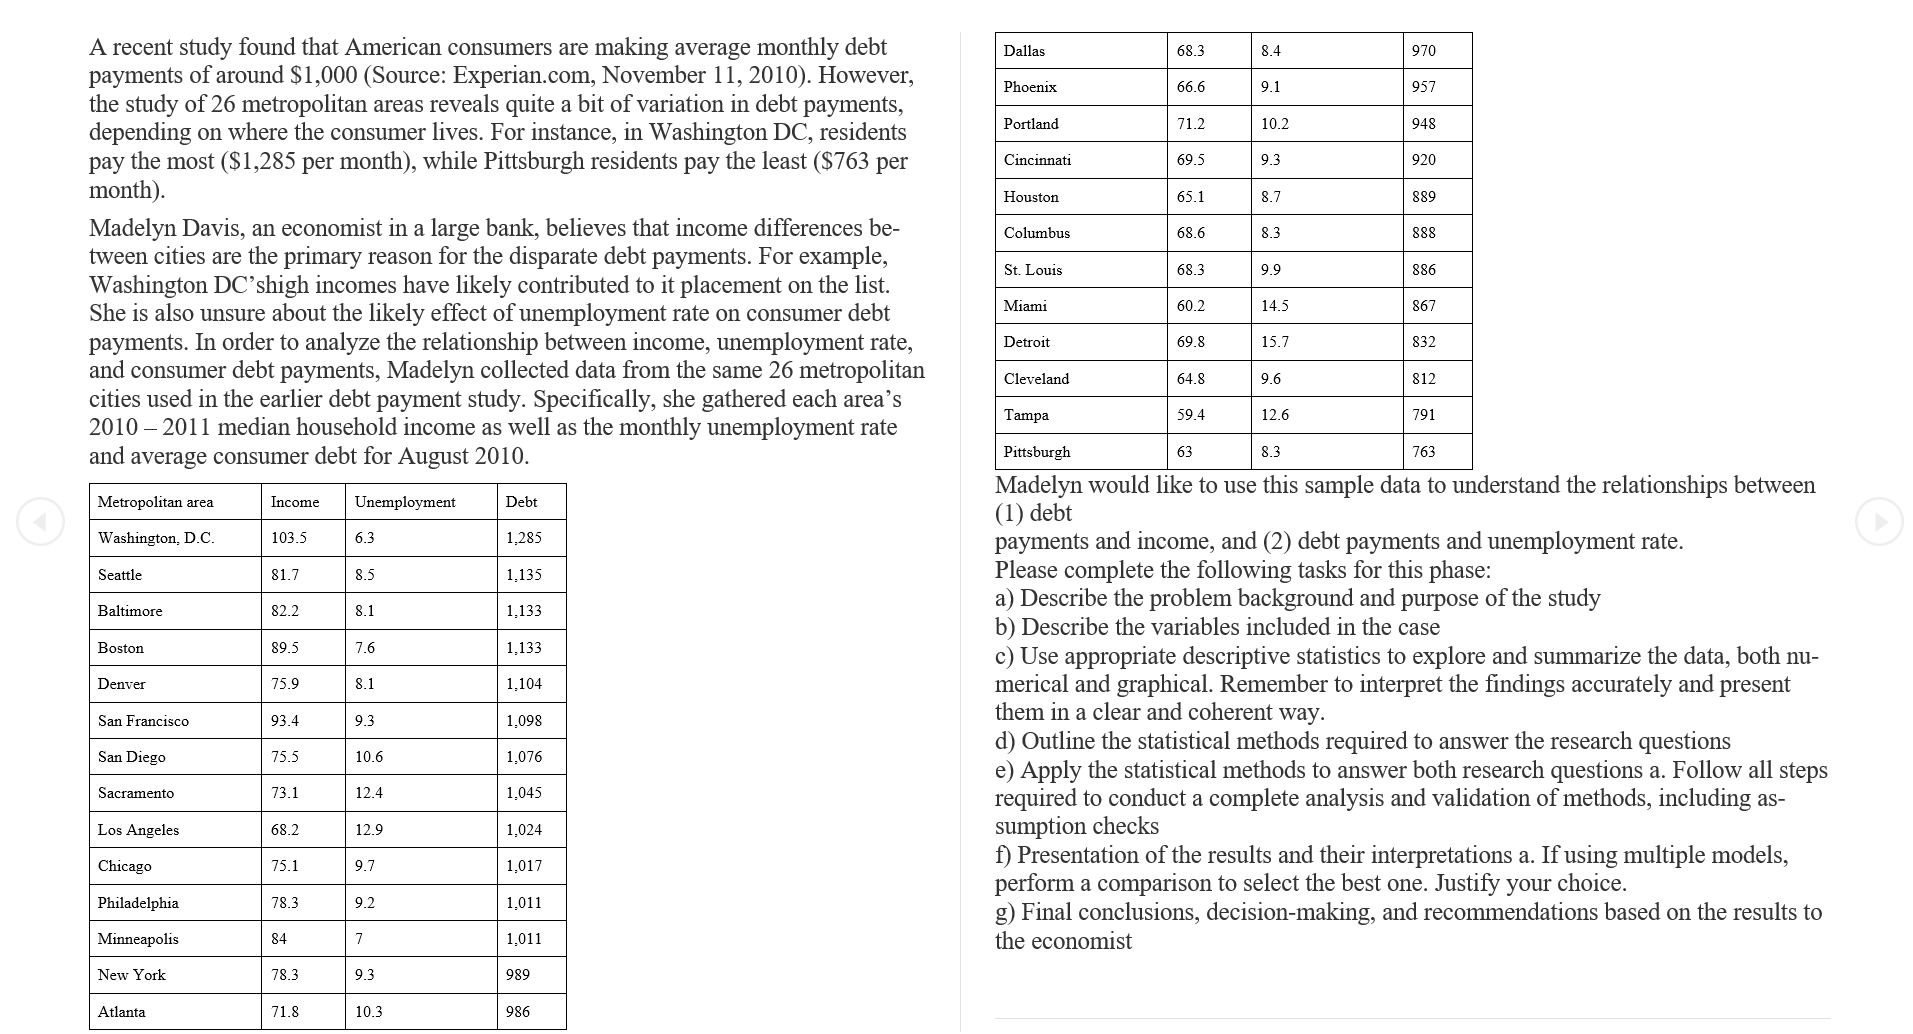
A recent study found that American consumers are making average monthly debt Dallas 68 3 8.4 970 payments of around $1,000 (Source: Experian.com, November 11, 2010). However, Phoenix 66.6 9.1 957 the study of 26 metropolitan areas reveals quite a bit of variation in debt payments, depending on where the consumer lives. For instance, in Washington DC, residents Portland 71.2 10.2 948 pay the most ($1,285 per month), while Pittsburgh residents pay the least ($763 per Cincinnati 69 5 9.3 920 month). Houston 65.1 8.7 889 Madelyn Davis, an economist in a large bank, believes that income differences be- Columbus 68.6 8.3 888 tween cities are the primary reason for the disparate debt payments. For example, St. Louis 68.3 9 9 886 Washington DC'shigh incomes have likely contributed to it placement on the list. She is also unsure about the likely effect of unemployment rate on consumer debt Miami 50.2 14.5 867 payments. In order to analyze the relationship between income, unemployment rate, Detroit 69 8 15.7 832 and consumer debt payments, Madelyn collected data from the same 26 metropolitan Cleveland 14.8 9.6 812 cities used in the earlier debt payment study. Specifically, she gathered each area's Tampa 59 4 12.6 791 2010 -2011 median household income as well as the monthly unemployment rate and average consumer debt for August 2010. Pittsburgh 8.3 763 Madelyn would like to use this sample data to understand the relationships between Metropolitan area Income Unemployment Debt (1) debt Washington, D.C. 103.5 6 1,285 payments and income, and (2) debt payments and unemployment rate. Seattle 81.7 8.5 1,135 Please complete the following tasks for this phase: Baltimore 82.2 81 1,133 a) Describe the problem background and purpose of the study b) Describe the variables included in the case Boston 89.5 7.6 1,133 c) Use appropriate descriptive statistics to explore and summarize the data, both nu- Denver 75.9 8.1 1,104 merical and graphical. Remember to interpret the findings accurately and present San Francisco 93.4 9.3 1.098 them in a clear and coherent way. d) Outline the statistical methods required to answer the research questions San Diego 75.5 10.6 1,076 e) Apply the statistical methods to answer both research questions a. Follow all steps Sacramento 73.1 12.4 1,045 required to conduct a complete analysis and validation of methods, including as- Los Angeles 68.2 12.9 1,024 sumption checks Chicago 75.1 9.7 1,017 f) Presentation of the results and their interpretations a. If using multiple models, perform a comparison to select the best one. Justify your choice. Philadelphia 78 3 9.2 1,011 g) Final conclusions, decision-making, and recommendations based on the results to Minneapolis 84 7 1,011 the economist New York 78.3 989 Atlanta 71.8 10.3 986
Step by Step Solution
There are 3 Steps involved in it

Get step-by-step solutions from verified subject matter experts