

Question: A researcher decides to plot the correlogram for US inflation in the period Q1-1991 / Q4 - 2018 for a total of 112 observation. The
A researcher decides to plot the correlogram for US inflation in the period Q1-1991 / Q4 - 2018 for a total of 112 observation. The correlogram is reported below: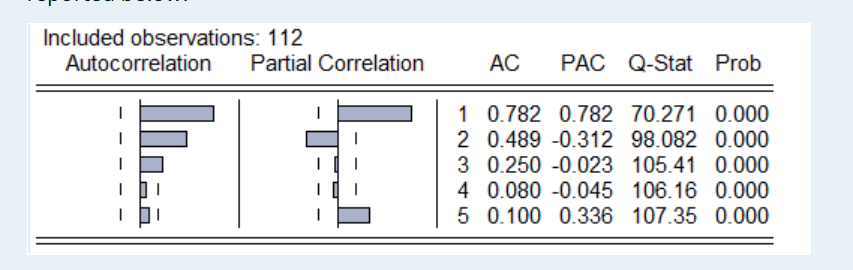
Select the correct answer.
a. Only the autocorrelation coefficient for lag 1 is statistically significant.
b.Only the autocorrelation coefficients for lags 1 and 2 are statistically significant.
c.Only the autocorrelation coefficients for lags 1, 2 and 3 are statistically significant.
d.Only the autocorrelation coefficients for lags 1,2, 3 and 4 are statistically significant.
e.All the autocorrelation coefficients for the first 5 lags are statistically significant.
Included observations: 112 Autocorrelation Partial Correlation AC PAC Q-Stat Prob 1 0.782 0.782 70.271 0.000 2 0.489 -0.312 98.082 0.000 3 0.250 -0.023 105.41 0.000 4 0.080 -0.045 106.16 0.000 5 0.100 0.336 107.35 0.000 Included observations: 112 Autocorrelation Partial Correlation AC PAC Q-Stat Prob 1 0.782 0.782 70.271 0.000 2 0.489 -0.312 98.082 0.000 3 0.250 -0.023 105.41 0.000 4 0.080 -0.045 106.16 0.000 5 0.100 0.336 107.35 0.000
Step by Step Solution
There are 3 Steps involved in it

Get step-by-step solutions from verified subject matter experts