

Question: Question 1 [1 point] A student decides to take a survey for her class project. She randomly surveys other students and records their Ranking user
![Question 1 [1 point] A student decides to take a survey](https://s3.amazonaws.com/si.experts.images/answers/2024/06/6673e73b59b05_8676673e73b33b63.jpg)

![a correct graphic? 0 Yes 0 No Question 2 [1 point] A](https://s3.amazonaws.com/si.experts.images/answers/2024/06/6673e73cbc359_8686673e73ca1bcd.jpg)


![point] For her class project in statistics, a student researcher decides to](https://s3.amazonaws.com/si.experts.images/answers/2024/06/6673e73e85d87_8706673e73e6a4b4.jpg)
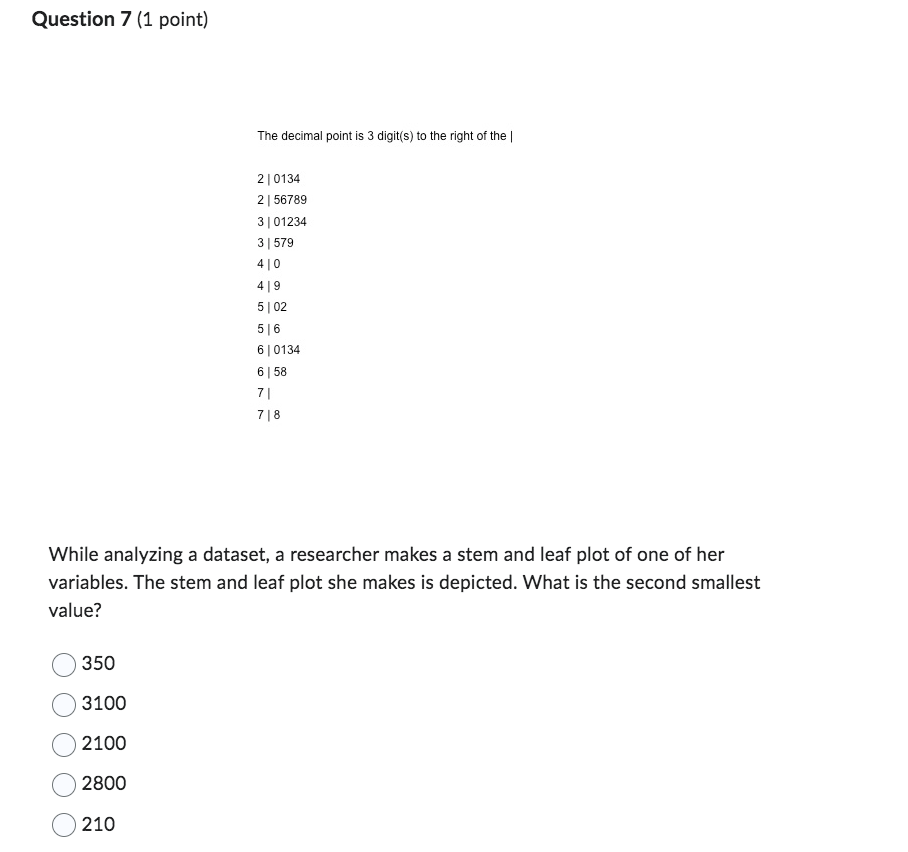
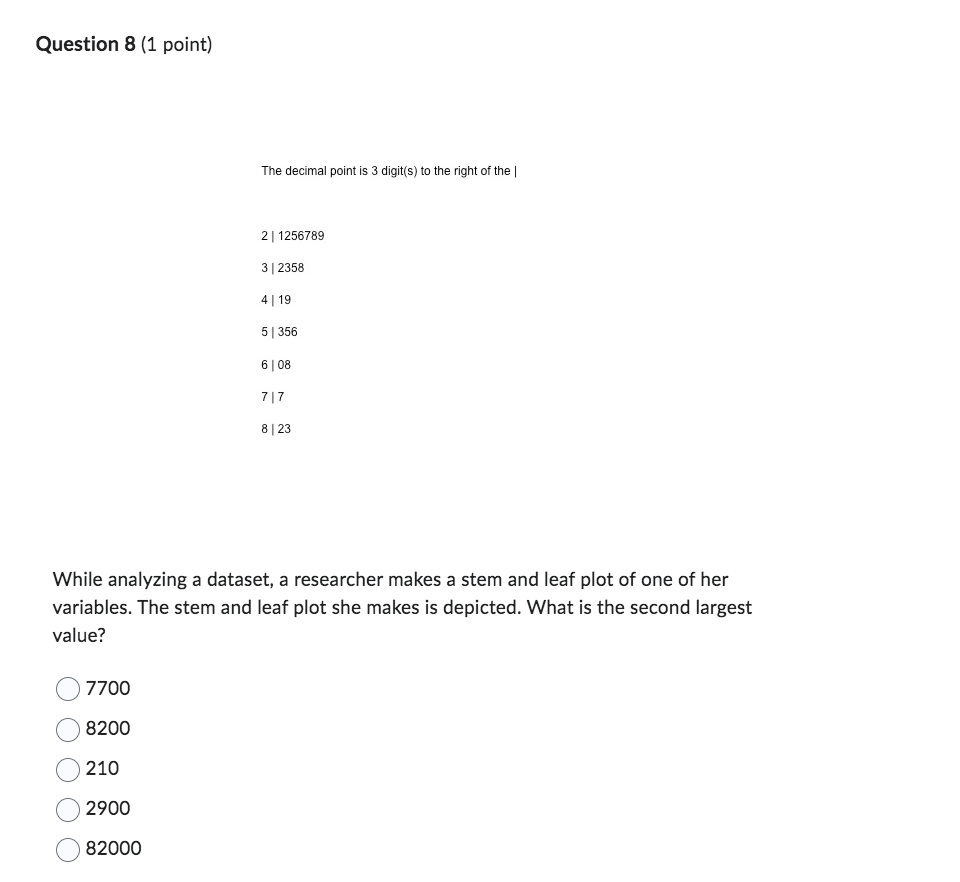
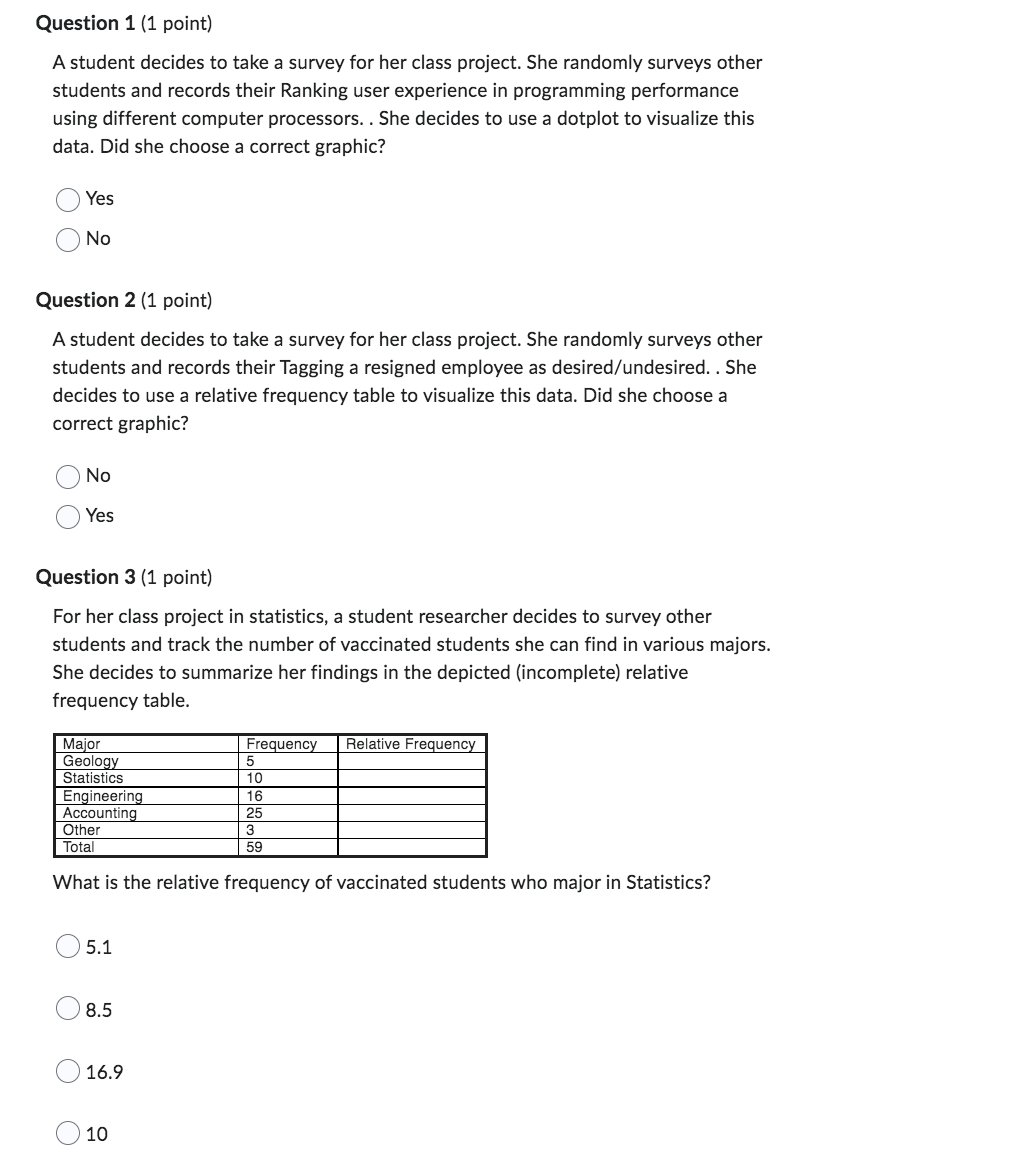
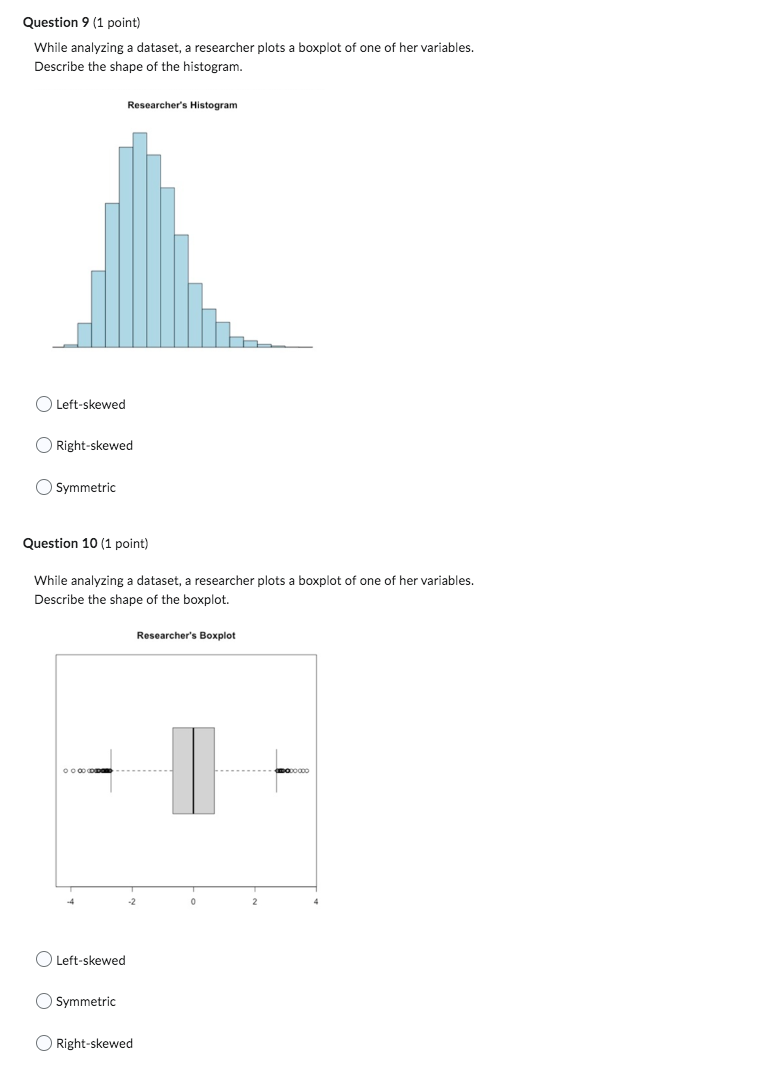
Question 1 [1 point] A student decides to take a survey for her class project. She randomly surveys other students and records their Ranking user experience in programming performance using different computer processors. . She decides to use a dotplot to visualize this data. Did she choose a correct graphic? 0 Yes 0 No Question 2 [1 point] A student decides to take a survey for her class project. She randomly surveys other students and records their Tagging a resigned employee as desired/undesired. . She decides to use a relative frequency table to visualize this data. Did she choose a correct graphic? 0 Yes Question 3 (1 point] For her class project in statistics, a student researcher decides to survey other students and track the number of vaccinated students she can find in various majors. She decides to summarize her findings in the depicted (incomplete) relative frequency table. Major Frequency Relative Frequency G eulogy 5 Statistics 1 I] E ngineering Accounting Other What is the relative frequency of vaccinated students who major in Statistics? Question 7 (1 point) The decimal point is 3 digit(s) to the right of the | 2 | 0134 2 | 56789 3 01234 3 | 579 410 419 5 | 02 516 6 | 0134 6 | 58 7 7 8 While analyzing a dataset, a researcher makes a stem and leaf plot of one of her variables. The stem and leaf plot she makes is depicted. What is the second smallest value? 350 3100 2100 2800 O 210Question 8 (1 point) The decimal point is 3 digit(s) to the right of the | 2 | 1256789 3 | 2358 4 19 5 | 356 6 | 08 717 8 | 23 While analyzing a dataset, a researcher makes a stem and leaf plot of one of her variables. The stem and leaf plot she makes is depicted. What is the second largest value? 7700 8200 210 2900 82000Question 9 (1 point) While analyzing a dataset, a researcher plots a boxplot of one of her variables. Describe the shape of the histogram. Researcher's Histogram Left-skewed Right-skewed O Symmetric Question 10 (1 point) While analyzing a dataset, a researcher plots a boxplot of one of her variables. Describe the shape of the boxplot. Researcher's Boxplot Left-skewed Symmetric O Right-skewedQuestion 4 (1 point) Saved Given the following five-number summary, 13 23 40 44 45. What percentage of data values are higher than 45? 75% O 100% O 0% Can't determine. 25%
Step by Step Solution
There are 3 Steps involved in it

Get step-by-step solutions from verified subject matter experts