

Question: A result called Chebyshev's inequality states that for any probability distribution of an rv X and any number k that is at least 1, P(
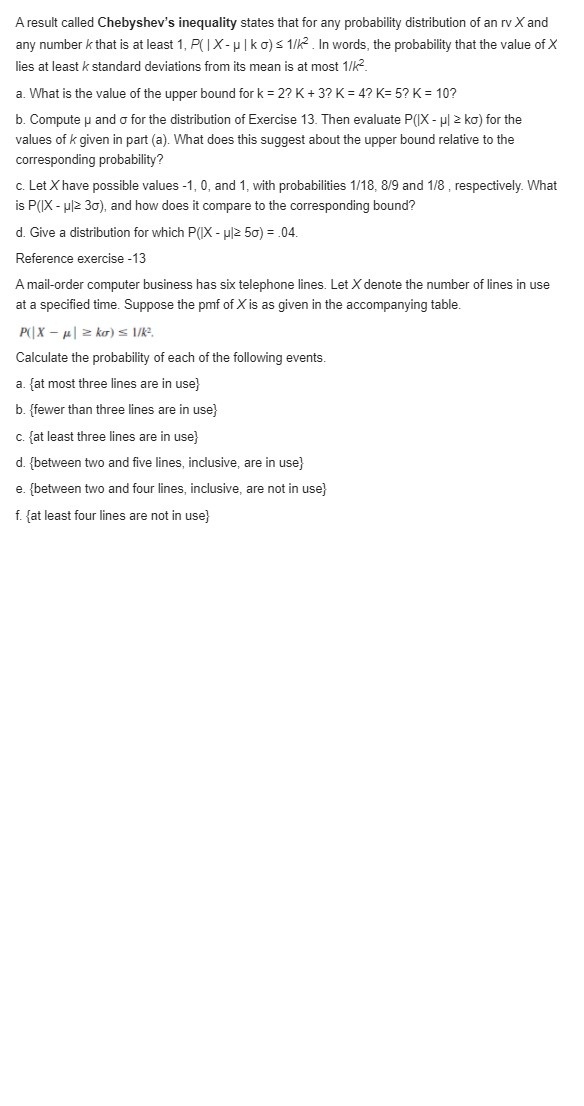
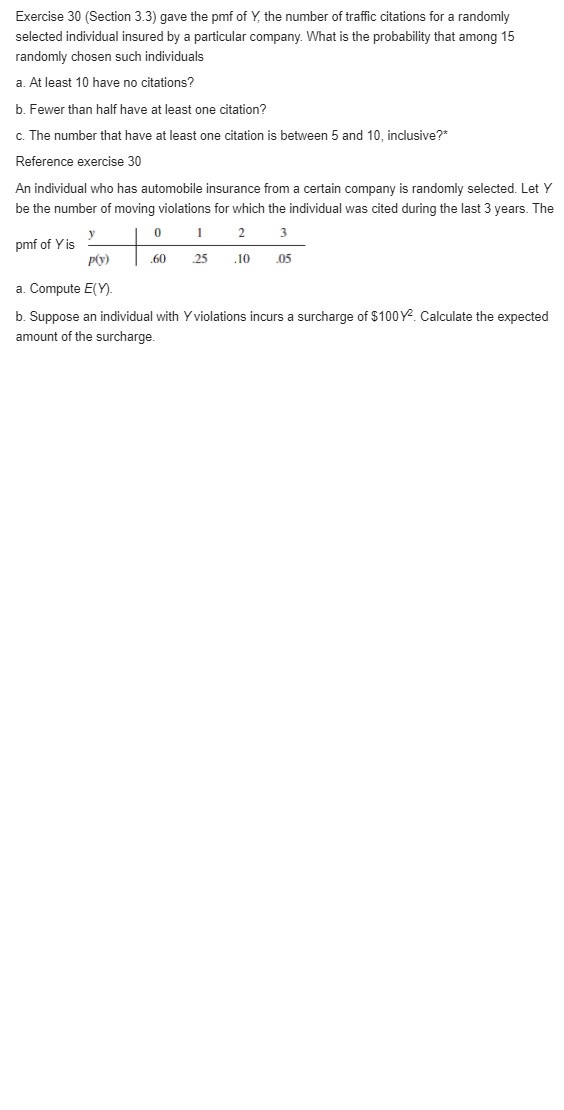
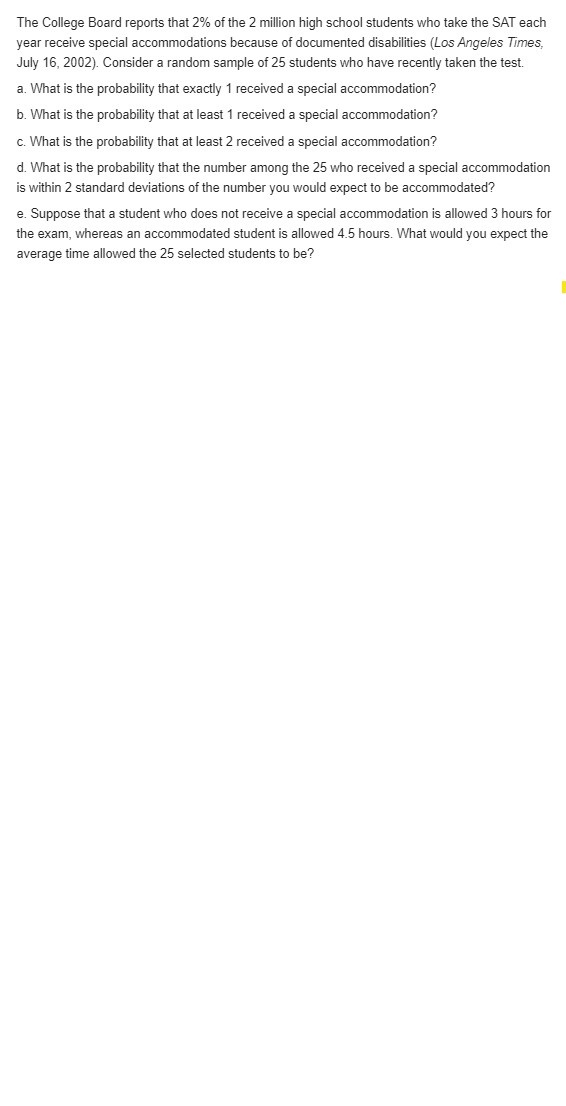
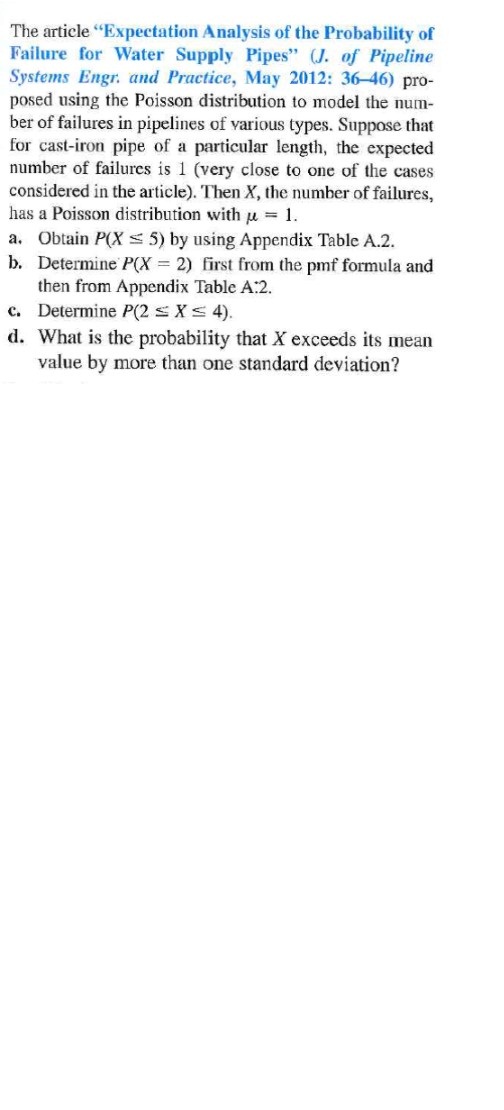
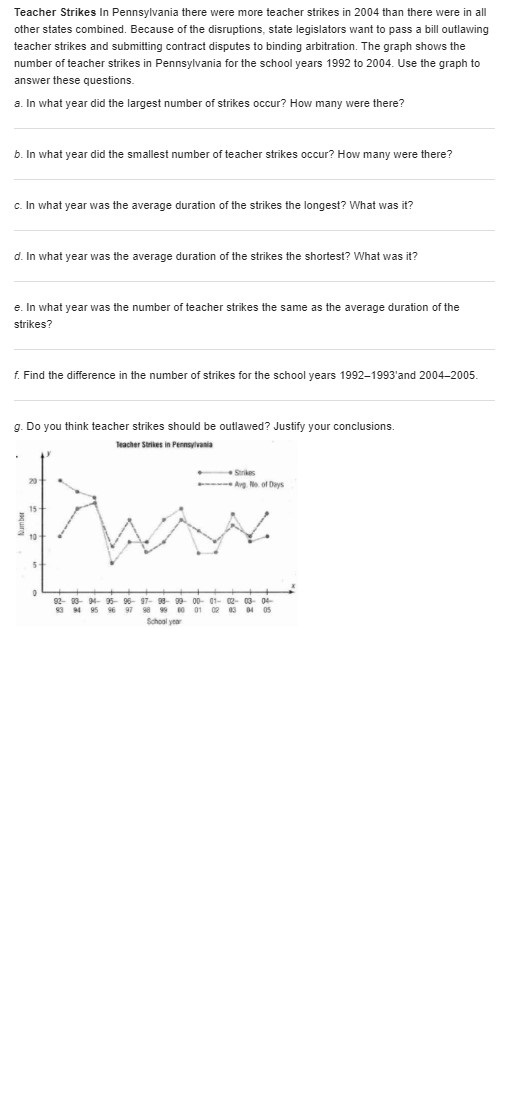
A result called Chebyshev's inequality states that for any probability distribution of an rv X and any number k that is at least 1, P( | X - p | k o) s 1/k . In words, the probability that the value of X lies at least k standard deviations from its mean is at most 1/12. a. What is the value of the upper bound for k = 2? K + 3? K = 4? K= 5? K = 10? b. Compute p and o for the distribution of Exercise 13. Then evaluate P(IX - p| > ko) for the values of k given in part (a). What does this suggest about the upper bound relative to the corresponding probability? c. Let X have possible values -1, 0, and 1, with probabilities 1/18, 8/9 and 1/8 , respectively. What is P(IX - p/2 30), and how does it compare to the corresponding bound? d. Give a distribution for which P(IX - p|2 50) = .04. Reference exercise -13 A mail-order computer business has six telephone lines. Let X denote the number of lines in use at a specified time. Suppose the pmf of X is as given in the accompanying table. P(| X - # | > ko) s 1/k2. Calculate the probability of each of the following events. a. {at most three lines are in use} b. {fewer than three lines are in use} c. {at least three lines are in use} d. {between two and five lines, inclusive, are in use} e. {between two and four lines, inclusive, are not in use} f. {at least four lines are not in use}Exercise 30 (Section 3.3) gave the pmf of Y, the number of traffic citations for a randomly selected individual insured by a particular company. What is the probability that among 15 randomly chosen such individuals a. At least 10 have no citations? b. Fewer than half have at least one citation? c. The number that have at least one citation is between 5 and 10, inclusive?* Reference exercise 30 An individual who has automobile insurance from a certain company is randomly selected. Let Y be the number of moving violations for which the individual was cited during the last 3 years. The 0 1 2 3 pmf of Y is P(y) .60 .25 .10 .05 a. Compute E(Y). b. Suppose an individual with Y violations incurs a surcharge of $100. Calculate the expected amount of the surcharge.The College Board reports that 2% of the 2 million high school students who take the SAT each year receive special accommodations because of documented disabilities {Los Angeles Times, July 15, 2902}. Consider a random sample of 25 students who have recently taken the test. a. What is the probability that exactly 1 received a special accommodation? b. What is the probability that at least 1 received a special accommodation? c. What is the probability that at least 2 received a special accommodation? d. What is the probability that the number among the 25 who received a special accommodation is within 2 standard deviations of the number you would expect to be accorrI'nodated'? e. Suppose that a student who does not receive a special accommodation is allowed 3 hours for the exam, whereas an accommodated student is allowed 4.5 hours. What would you expect the average time allowed the 25 selected students to be? The article "Expectation Analysis of the Probability of Failure for Water Supply Pipes" (J. of Pipeline Systems Engr. and Practice, May 2012: 36-46) pro- posed using the Poisson distribution to model the num- ber of failures in pipelines of various types. Suppose that for cast-iron pipe of a particular length, the expected number of failures is 1 (very close to one of the cases considered in the article). Then X, the number of failures, has a Poisson distribution with p = 1. a. Obtain P(X = 5) by using Appendix Table A.2. b. Determine P(X = 2) first from the pmf formula and then from Appendix Table A:2. c. Determine P(2 s X = 4). d. What is the probability that X exceeds its mean value by more than one standard deviation?Teacher Strikes In Pennsylvania there were more teacher strikes in 2004 than there were in all other states combined. Because of the disruptions, state legislators want to pass a bill outlawing teacher strikes and submitting contract disputes to binding arbitration. The graph shows the number of teacher strikes in Pennsylvania for the school years 1992 to 2004. Use the graph to answer these questions. a. In what year did the largest number of strikes occur? How many were there? b. In what year did the smallest number of teacher strikes occur? How many were there? c. In what year was the average duration of the strikes the longest? What was it? d. In what year was the average duration of the strikes the shortest? What was it? e. In what year was the number of teacher strikes the same as the average duration of the strikes? f. Find the difference in the number of strikes for the school years 1992-1993'and 2004-2005. g. Do you think teacher strikes should be outlawed? Justify your conclusions. Teacher Strikes in Pennsylvania Strikes 20 - Arg. Milo. of Days 15 Number 10 5 M- 95 95- 17- 95 96 97 98 99 39 00- 41- 02- 04- 01 School yearConsider writing onto a computer disk and then sending it through a certifier that counts the number of missing pulses. Suppose this number X has a Poisson distribution with parameter p = 2. (Suggested in "Average Sample Number for Semi-Curtailed Sampling Using the Poisson Distribution," J. Quality Technology, 1983: 126-129.) a. What is the probability that a disk has exactly one missing pulse? b. What is the probability that a disk has at least two missing pulses? c. If two disks are independently selected, what is the probability that neither contains a missing pulse?Construct a probability plot that will allow you to assess the plausibility of the lognormal distribution as a model for the rainfall data of Exercise 83 in Chapter 1. Reference exercise 83 Consider numerical observations X,.........X, . It is frequently of interest to know whether the xi s are (at least approximately) symmetrically distributed about some value. If n is at least moderately large, the extent of symmetry can be assessed from a stem-and-leaf display or histogram. However, if n is not very large, such pictures are not particularly informative. Consider the following alternative. Let y, denote the smallest x;, y2 the second smallest xi, and so on. Then plot the following pairs as points on a two-dimensional coordinate system: X1, . . . . *," There are n/2 points when n is even and (n-1)/2 when n is odd. a. What does this plot look like when there is perfect symmetry in the data? What does it look like when observations stretch out more above the median than below it (a long upper tail)? b. The accompanying data on rainfall (acre-feet) from 26 seeded clouds is taken from the article "A Bayesian Analysis of a Multiplicative Treatment Effect in Weather Modification" (Technometrics, 1975: 161-166). Construct the plot and comment on the extent of symmetry or nature of departure from symmetry
Step by Step Solution
There are 3 Steps involved in it

Get step-by-step solutions from verified subject matter experts