

Question: A) return for 2016 B)return for 2017 c)return for 2018 d) return for 2019 and using data prom problem, calculate the portfolio standard deviation Your
A) return for 2016
B)return for 2017
c)return for 2018
d) return for 2019
and using data prom problem, calculate the portfolio standard deviation
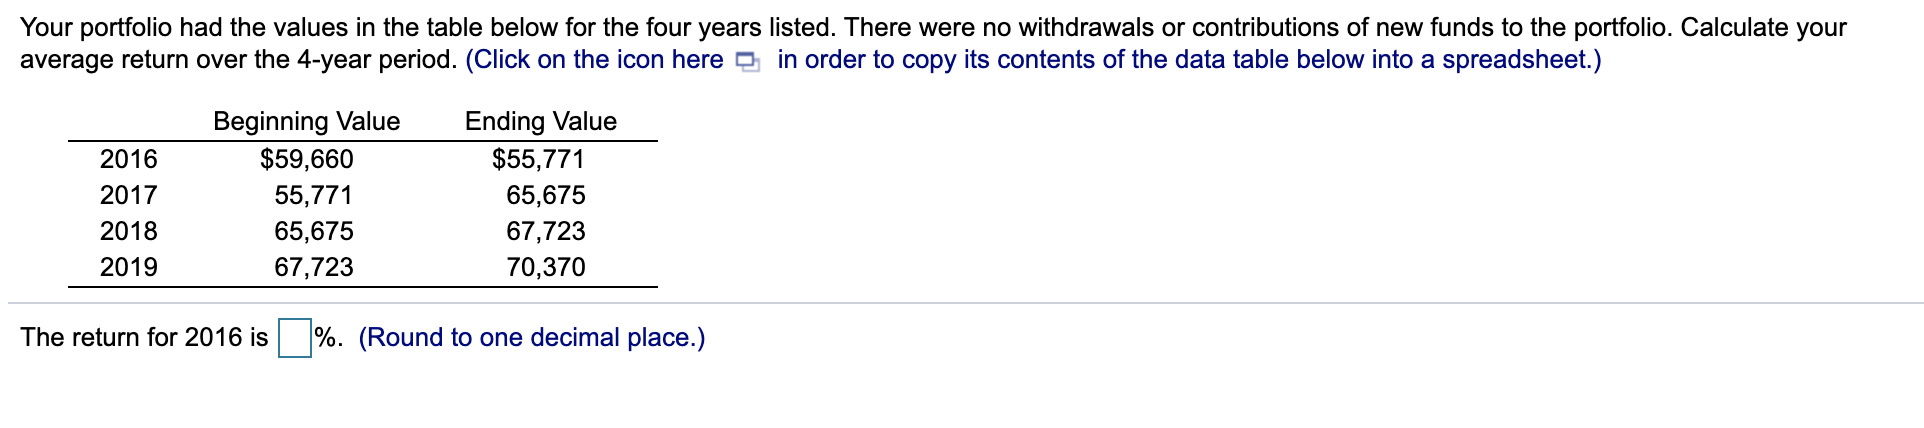
Your portfolio had the values in the table below for the four years listed. There were no withdrawals or contributions of new funds to the portfolio. Calculate your average return over the 4-year period. (Click on the icon here e in order to copy its contents of the data table below into a spreadsheet.) 2016 2017 2018 2019 Beginning Value $59,660 55,771 65,675 67,723 Ending Value $55,771 65,675 67,723 70,370 The return for 2016 is %. (Round to one decimal place.)
Step by Step Solution
There are 3 Steps involved in it
1 Expert Approved Answer
Step: 1 Unlock

Question Has Been Solved by an Expert!
Get step-by-step solutions from verified subject matter experts
Step: 2 Unlock
Step: 3 Unlock