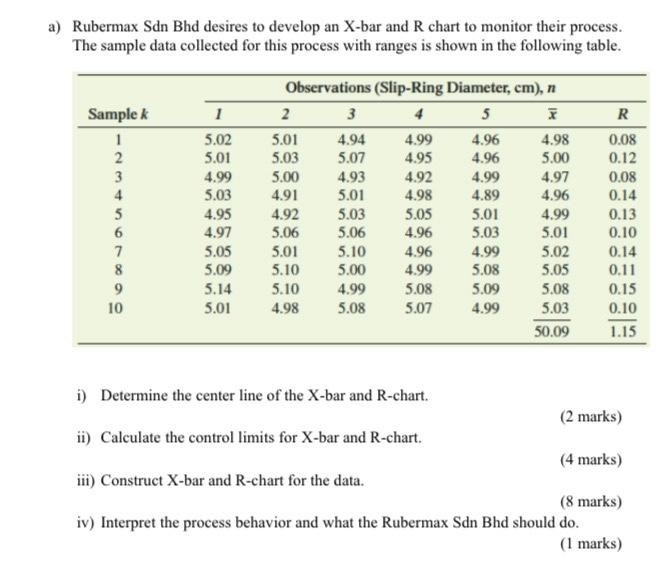
Question: a) Rubermax Sdn Bhd desires to develop an X-bar and R chart to monitor their process. The sample data collected for this process with ranges

a) Rubermax Sdn Bhd desires to develop an X-bar
a) Rubermax Sdn Bhd desires to develop an X-bar and R chart to monitor their process. The sample data collected for this process with ranges is shown in the following table. Observations (Slip-Ring Diameter, cm), n Sample 1 2 3 4 5 R 1 5.02 5.01 4.94 4.99 4.96 4.98 0.08 2 5.01 5.03 5.07 4.95 4.96 5.00 0.12 3 4.99 5.00 4.93 4.92 4.99 4.97 0.08 4 5.03 4.91 5.01 4.98 4.89 4.96 0.14 5 4.95 4.92 5.03 5.05 5.01 4.99 0.13 6 4.97 5.06 5.06 4.96 5.03 5.01 0.10 7 5.05 4.96 4.99 5.02 0.14 8 5.09 5.10 5.00 4.99 5.08 5.05 0.11 9 5.14 5.10 4.99 5.08 5.09 5.08 0.15 10 5.01 4.98 5.08 5.07 4.99 5.03 0.10 50.09 1.15 5.01 5.10 i) Determine the center line of the X-bar and R-chart. (2 marks) ii) Calculate the control limits for X-bar and R-chart. (4 marks) iii) Construct X-bar and R-chart for the data. (8 marks) iv) Interpret the process behavior and what the Rubermax Sdn Bhd should do. (1 marks) 1) Control Limits for X-bar and R-chart UCL ; = X + AGR UCL= D.R LCL; = X - AL LCL, =D,R 2) Control Chart Factors X-bar and R Chart X-bar and S Chart Sample Size (n) Az DD A | B | Ba 3 1.023 0 2.574 1.954 0 2.568 4 0.729 0 2.282 1.628 0 2.266 5 5 0.577 0 2.114 1.427 o 2.089 6 0.483 0 2.004 1.287 0.030 1.970 7 0.419 0.076 1.924 1.182 0.118 1.882

Step by Step Solution

There are 3 Steps involved in it

1 Expert Approved Answer
Step: 1 Unlock blur-text-image
Question Has Been Solved by an Expert!

Get step-by-step solutions from verified subject matter experts

Step: 2 Unlock
Step: 3 Unlock

Students Have Also Explored These Related General Management Questions!