

Question: Please solve and send asap . (a) Determine the center line of the X-bar and R-chart. (3 marks) (b) Calculate the control limits for X-bar
Please solve and send asap .
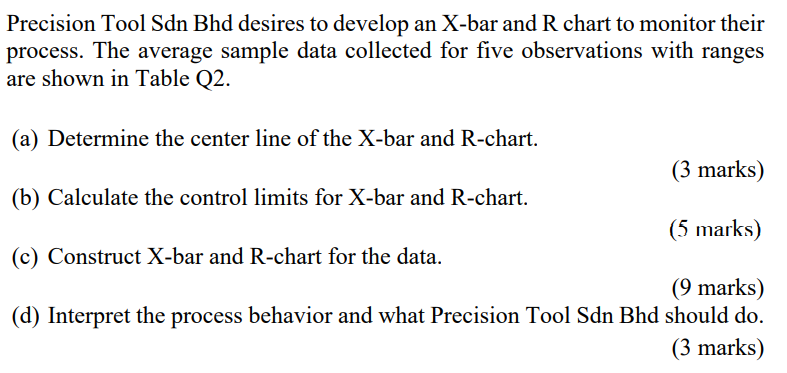
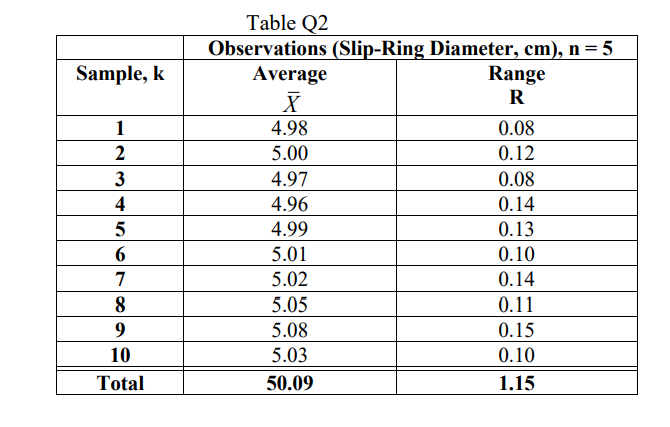
(a) Determine the center line of the X-bar and R-chart. (3 marks) (b) Calculate the control limits for X-bar and R-chart. (5 marks) (c) Construct X-bar and R-chart for the data. (9 marks) (d) Interpret the process behavior and what Precision Tool Sdn Bhd should do.
Step by Step Solution
There are 3 Steps involved in it
1 Expert Approved Answer
Step: 1 Unlock

Question Has Been Solved by an Expert!
Get step-by-step solutions from verified subject matter experts
Step: 2 Unlock
Step: 3 Unlock