

Question: A sales manager collected data on annual sales for new customer accounts and the number of years of experience for a sample of 10 salespersons.
A sales manager collected data on annual sales for new customer accounts and the number of years of experience for a sample of 10 salespersons. In the Microsoft Excel Online file below you will find a sample of data on years of experience of the salesperson and annual sales. Conduct a regression analysis to explore the relationship between these two variables and then answer the following questions.
Due to a recent change by Microsoft you will need to open the XLMiner Analysis ToolPak add-in manually from the home ribbon.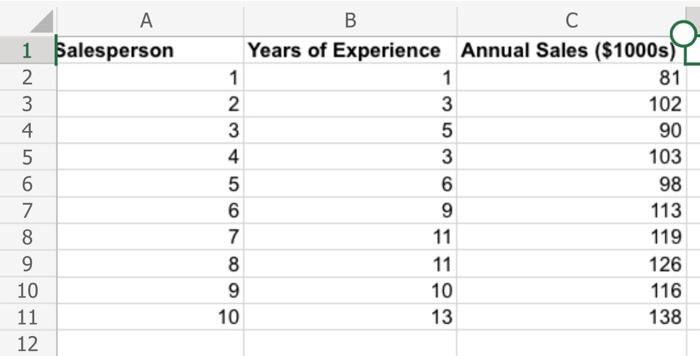
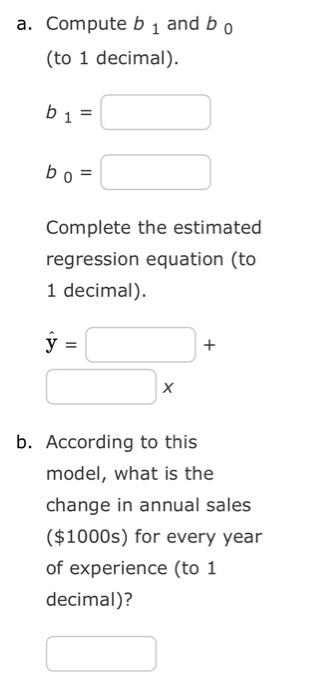
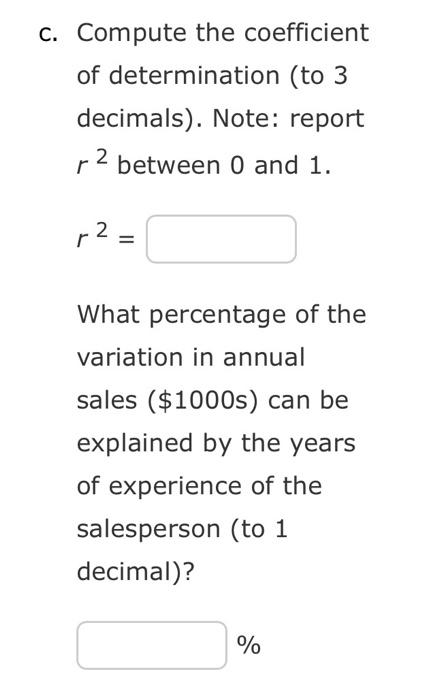
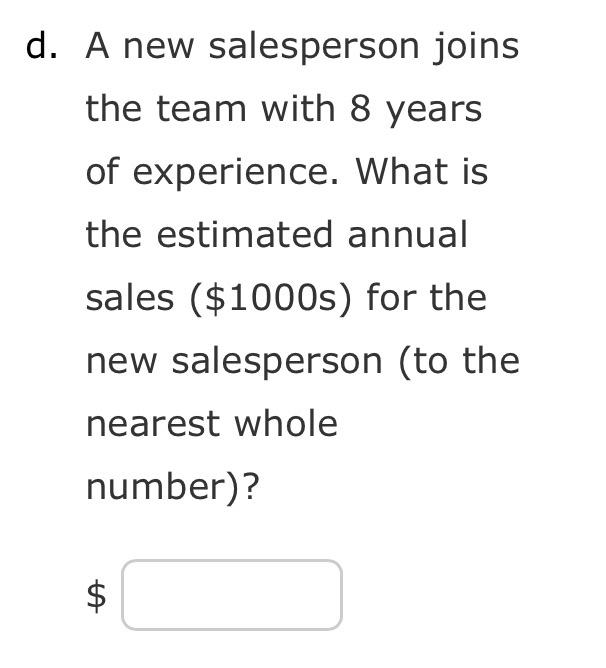
a. Compute b1 and b0 (to 1 decimal). b1= b0= Complete the estimated regression equation (to 1 decimal). y^=+ x b. According to this model, what is the change in annual sales (\$1000s) for every year of experience (to 1 decimal)? Compute the coefficient of determination (to 3 decimals). Note: report r2 between 0 and 1 . r2= What percentage of the variation in annual sales ( $1000s ) can be explained by the years of experience of the salesperson (to 1 decimal)? % A new salesperson joins the team with 8 years of experience. What is the estimated annual sales ( $1000 s) for the new salesperson (to the nearest whole number)? $
Step by Step Solution
There are 3 Steps involved in it

Get step-by-step solutions from verified subject matter experts