

Question: a) Sample 1 Sample 2 Sample 3 Sample 4 4.5 4.6 4.5 4.7 4.2 4.5 4.6 4.6 4.2 4.4 4.4 4.8 4.3 4.7 4.4 4.5
a)
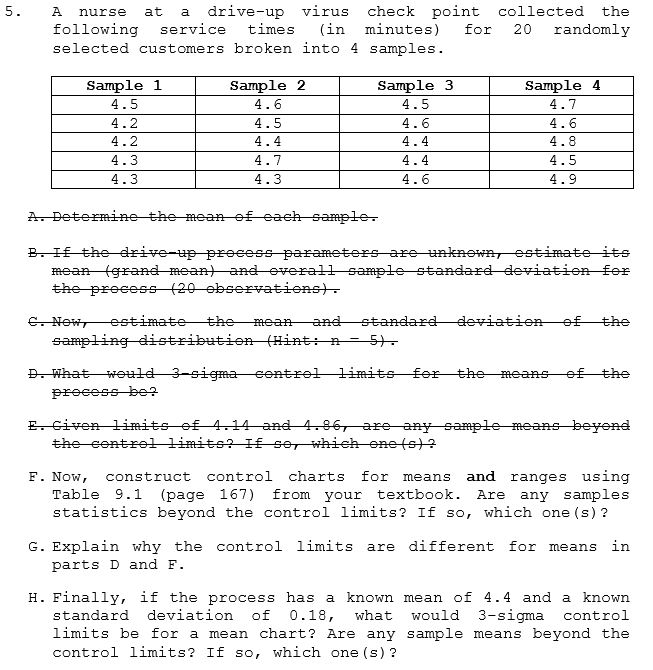
| Sample 1 | Sample 2 | Sample 3 | Sample 4 | |
| 4.5 | 4.6 | 4.5 | 4.7 | |
| 4.2 | 4.5 | 4.6 | 4.6 | |
| 4.2 | 4.4 | 4.4 | 4.8 | |
| 4.3 | 4.7 | 4.4 | 4.5 | |
| 4.3 | 4.3 | 4.6 | 4.9 | |
| Mean | 4.3 | 4.5 | 4.5 | 4.7 |
b)
| Grand Mean | 4.5 |
| Standard Deviation | 0.180278 |
c)
| Sample 1 | Sample 2 | Sample 3 | Sample 4 | |
| 4.5 | 4.6 | 4.5 | 4.7 | |
| 4.2 | 4.5 | 4.6 | 4.6 | |
| 4.2 | 4.4 | 4.4 | 4.8 | |
| 4.3 | 4.7 | 4.4 | 4.5 | |
| 4.3 | 4.3 | 4.6 | 4.9 | |
| Mean | 4.3 | 4.5 | 4.5 | 4.7 |
| Std dev | 0.1 | 0.129099 | 0.08165 | 0.129099 |
d)
| Sample 1 | Sample 2 | Sample 3 | Sample 4 | |
| 4.5 | 4.6 | 4.5 | 4.7 | |
| 4.2 | 4.5 | 4.6 | 4.6 | |
| 4.2 | 4.4 | 4.4 | 4.8 | |
| 4.3 | 4.7 | 4.4 | 4.5 | |
| 4.3 | 4.3 | 4.6 | 4.9 | |
| Mean | 4.3 | 4.5 | 4.5 | 4.7 |
| Std dev | 0.1 | 0.129099 | 0.08165 | 0.129099 |
| 3 sigma (Upper) | 4.6 | 4.887298 | 4.744949 | 5.087298 |
| 3 sigma (Lower) | 4 | 4.112702 | 4.255051 | 4.312702 |
e) One sample is outside in sample 4
5. A nurse at a drive-up virus check point collected the following service times (in minutes) for 20 randomly selected customers broken into 4 samples. Sample 3 4.5 4.6 Sample 1 4.5 4.2 4.2 4.3 4.3 Sample 2 4.6 4.5 4.4 4.7 4.3 Sample 4 4.7 4.6 4.8 4.5 4.4 4.6 A. Determine the mean of each sample. B. If the drive-up process parameters are unknown estimate its mean grand mean) and overall sample standard deviation for the process 20 observations) C. Now estimate the mean and standard deviation of the sampling distribution (Hint: A - 51 - D. What would 3-sigma control limits for the means of the process be? E. Given limits of 4.14 and 4.86 are any sample means beyond the centrel limits? If so, which one ist? F. Now, construct control charts for means and ranges using Table 9.1 (page 167) from your textbook. Are any samples statistics beyond the control limits? If so, which one (s)? G. Explain why the control limits are different for means in parts D and F. H. Finally, if the process has a known mean of 4.4 and a known standard deviation of 0.18, what would 3-sigma control limits be for a mean chart? Are any sample means beyond the control limits? If so, which one (s)Step by Step Solution
There are 3 Steps involved in it
1 Expert Approved Answer
Step: 1 Unlock

Question Has Been Solved by an Expert!
Get step-by-step solutions from verified subject matter experts
Step: 2 Unlock
Step: 3 Unlock