

Question: (a) Select the scatter plot that best represents the data. 000+y Debt and Tax Tax 500 000 500- 000- 500. 000 500 000- 500.
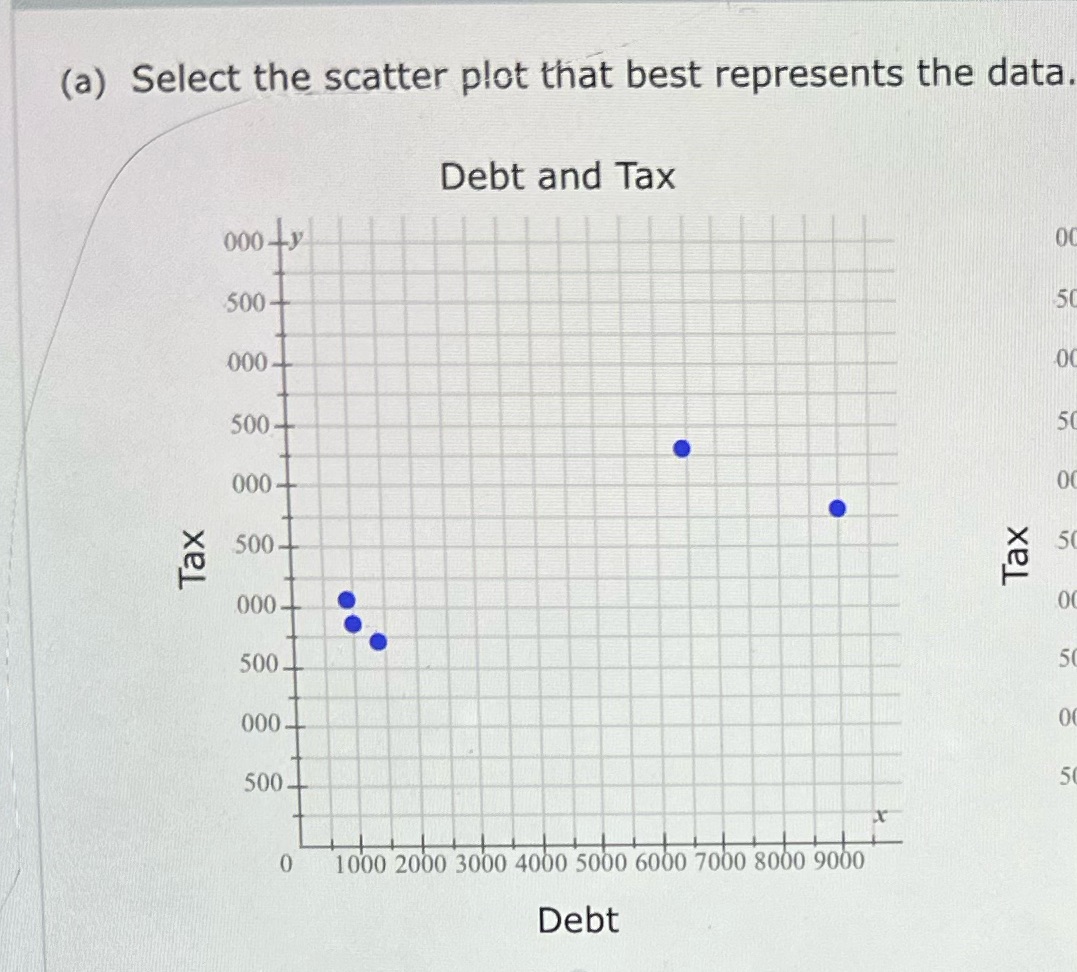
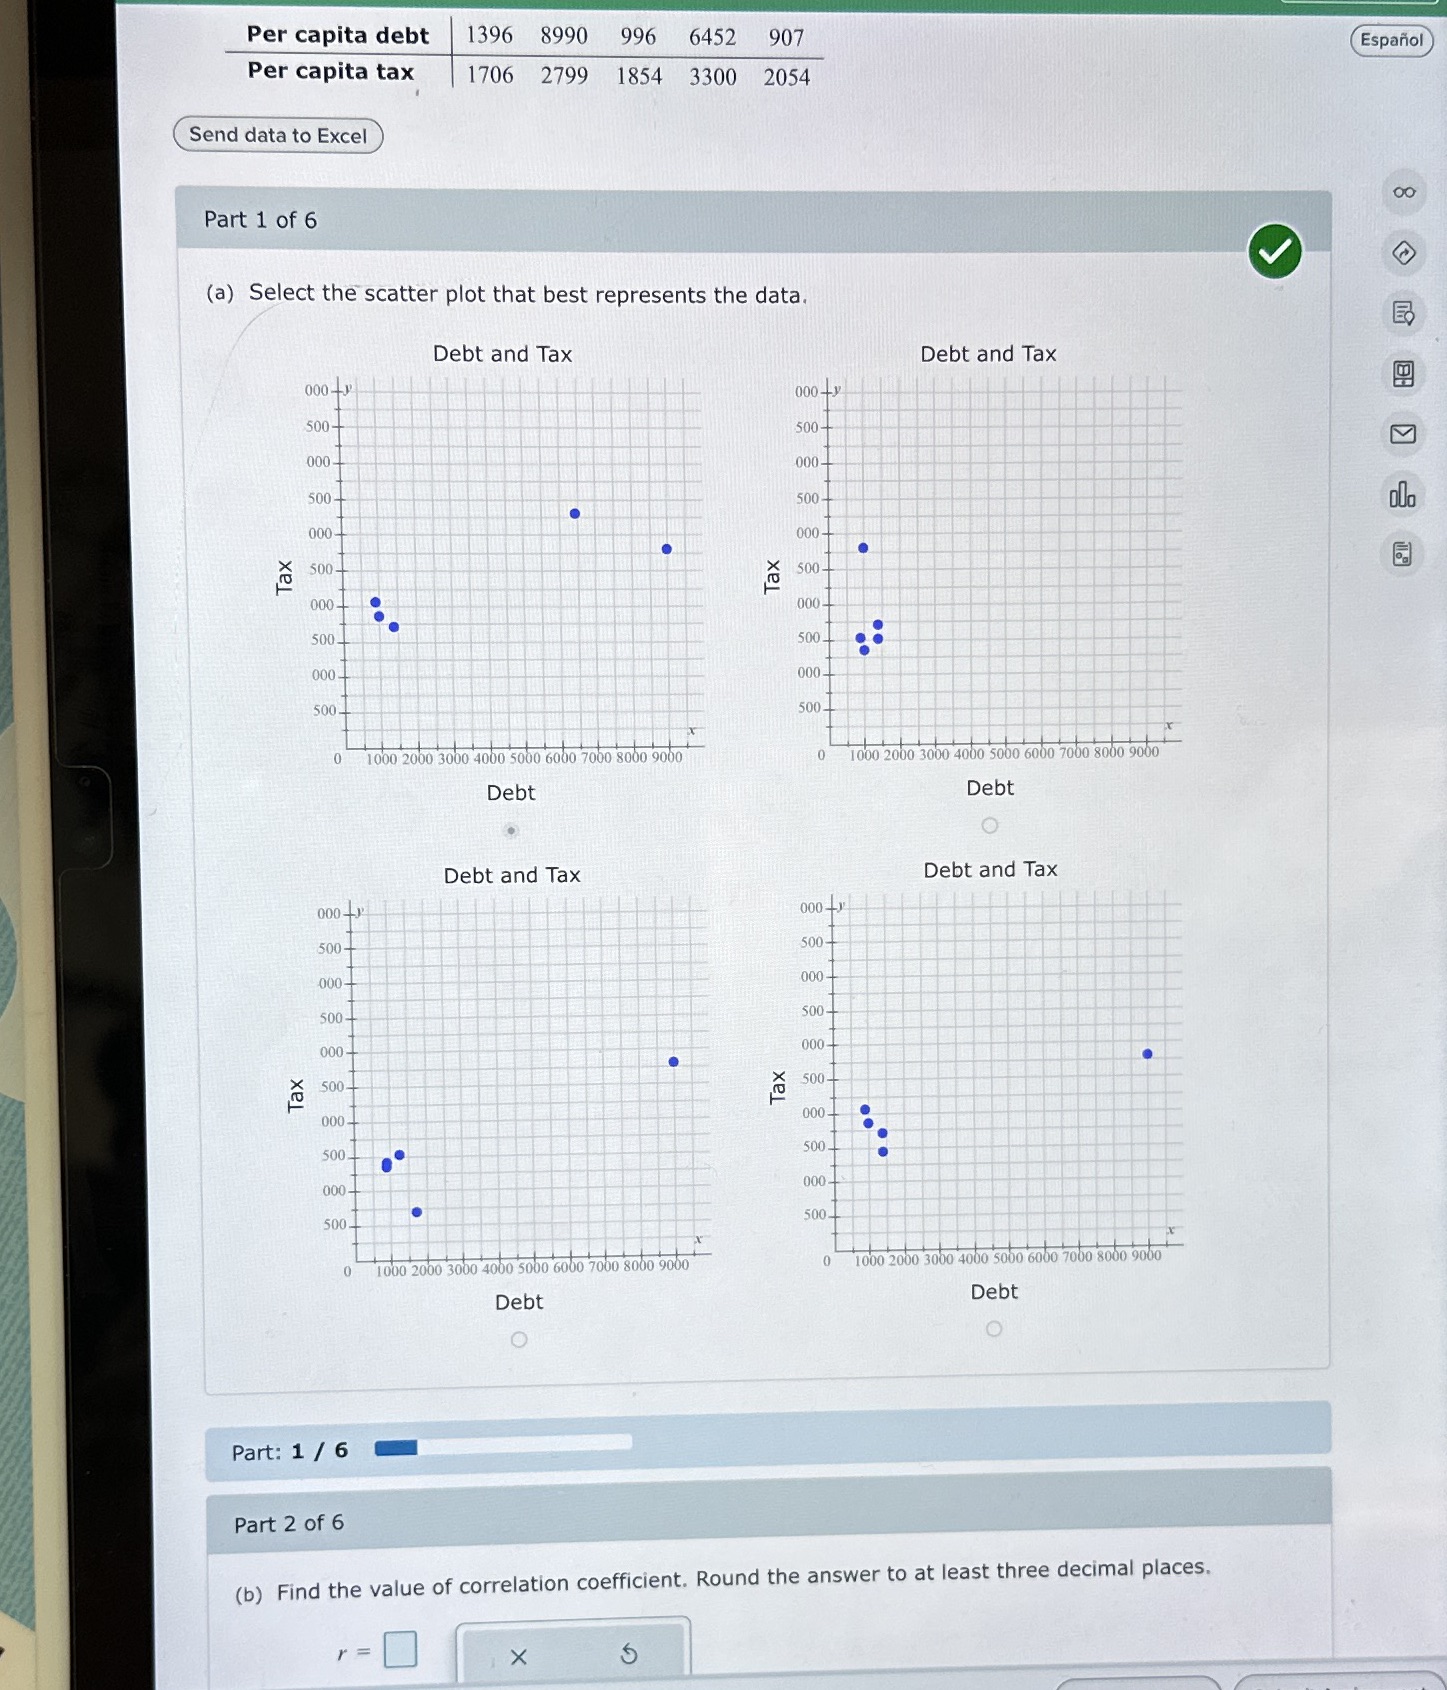
(a) Select the scatter plot that best represents the data. 000+y Debt and Tax Tax 500 000 500- 000- 500. 000 500 000- 500. 0 6000 1000 2000 3000 4000 5000 6000 7000 8000 9000 Debt 00 50 00 50 00 50 00 50 00 50 Tax Part: 1/6 Tax Per capita debt Per capita tax 1396 8990 996 6452 907 1706 2799 1854 3300 2054 Espaol Send data to Excel Part 1 of 6 (a) Select the scatter plot that best represents the data. Tax Debt and Tax 000- 500- 000- 500 000- Debt and Tax 000-y 500- 000- 500- 000- 500 Tax 500- 000- 500- 000- 500. 000- 500- 000- 500- 0 1000 2000 3000 4000 5000 6000 7000 8000 9000 0 Debt 1000 2000 3000 4000 5000 6000 7000 8000 9000 Debt 000 500- Debt and Tax 000- 500- 000- 500- 000+ 500. 000- 500. Tax Debt and Tax 000 500- 000- 500- 000- 500- 000- 500. 000- 500- 0 1000 2000 3000 4000 5000 6000 7000 8000 9000 0 1000 2000 3000 4000 5000 6000 7000 8000 9000 Debt Debt Part 2 of 6 (b) Find the value of correlation coefficient. Round the answer to at least three decimal places. r =
Step by Step Solution
There are 3 Steps involved in it

Get step-by-step solutions from verified subject matter experts