

Question: A sieve analysis test was conducted on an aggregate source and resulted in the following data: Calculate the percentage passing for each sieve and plot
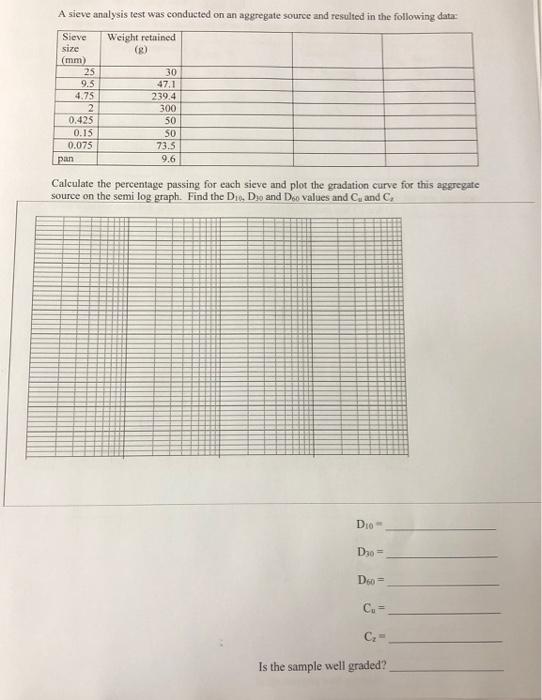
A sieve analysis test was conducted on an aggregate source and resulted in the following data:
Calculate the percentage passing for each sieve and plot the gradation curve for this aggregate
source on the semi log graph. Find the D D and D values and Cu and Cz
Step by Step Solution
There are 3 Steps involved in it
1 Expert Approved Answer
Step: 1 Unlock

Question Has Been Solved by an Expert!
Get step-by-step solutions from verified subject matter experts
Step: 2 Unlock
Step: 3 Unlock