

Question: A sparkline is a small embedded line graph that illustrates a single trend? True False QUESTION 11 A Time-Series chart is a graphical representation show
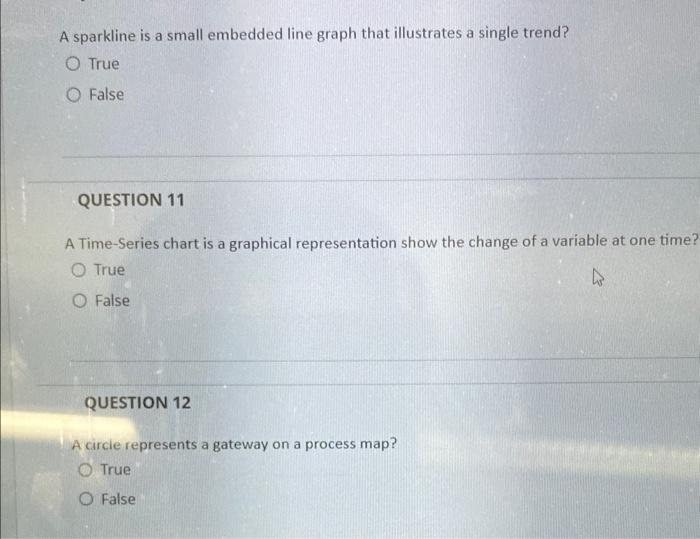
A sparkline is a small embedded line graph that illustrates a single trend? True False QUESTION 11 A Time-Series chart is a graphical representation show the change of a variable at one time? True False QUESTION 12 A circie represents a gateway on a process map? True False
Step by Step Solution
There are 3 Steps involved in it
1 Expert Approved Answer
Step: 1 Unlock

Question Has Been Solved by an Expert!
Get step-by-step solutions from verified subject matter experts
Step: 2 Unlock
Step: 3 Unlock