

Question: A stained protein (glutamic dehydrogenase) was made to migrate through a polyacrylamide gel during electrophoresis. The position of the protein was measured as a
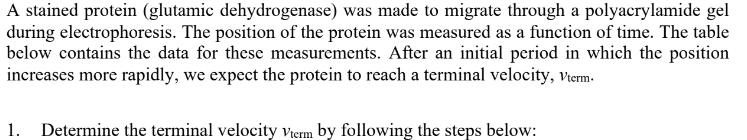
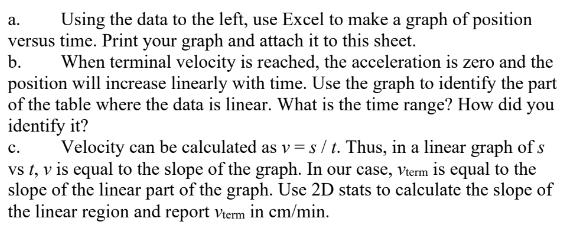
A stained protein (glutamic dehydrogenase) was made to migrate through a polyacrylamide gel during electrophoresis. The position of the protein was measured as a function of time. The table below contains the data for these measurements. After an initial period in which the position increases more rapidly, we expect the protein to reach a terminal velocity, Vterm. 1. Determine the terminal velocity Vterm by following the steps below: Time Position (min) (cm) 3 0.9 4 1.3 5.17 1.5 6.5 1.7 7 1.83 8 1.95 9 2.1 10 2.15 11 2.23 12 14 2.45 15 2.55 16 2.6 17 2.65 18 2.75 19 2.8 20 2.85 23 3.05 25 3.2 a. Using the data to the left, use Excel to make a graph of position versus time. Print your graph and attach it to this sheet. b. When terminal velocity is reached, the acceleration is zero and the position will increase linearly with time. Use the graph to identify the part of the table where the data is linear. What is the time range? How did you identify it? c. Velocity can be calculated as v = st. Thus, in a linear graph of s vs t, v is equal to the slope of the graph. In our case, Vterm is equal to the slope of the linear part of the graph. Use 2D stats to calculate the slope of the linear region and report Viem in cm/min.
Step by Step Solution
There are 3 Steps involved in it

Get step-by-step solutions from verified subject matter experts