

Question: A statistics instructor wonders whether significant differences exist in her students' average exam scores in her three different sections. She randomly selects the scores from
A statistics instructor wonders whether significant differences exist in her students' average exam scores in her three different sections. She randomly selects the scores from 10 students in each section. A portion of the data is shown in the accompanying table. Assume exam scores are normally distributed. (You may find it useful to reference the F table at https://ezt.prod.mheducation.com/Media/Connect_Production/bne/jaggia_ess2e/table/table_4.jpg ).
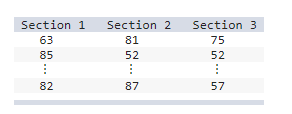
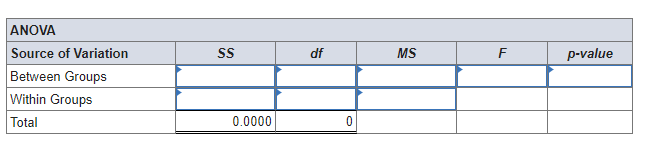
Section 1 Section 2 Section 3 63 81 75 85 52 52 82 87 57ANOVA Source of Variation SS of MS F p-value Between Groups Within Groups Total 0.0000
Step by Step Solution
There are 3 Steps involved in it
1 Expert Approved Answer
Step: 1 Unlock

Question Has Been Solved by an Expert!
Get step-by-step solutions from verified subject matter experts
Step: 2 Unlock
Step: 3 Unlock