

Question: . statistics instructor wonders whether signicant differences exist in her students final exam scores in her three different sections. She randomlillr selects the scores from
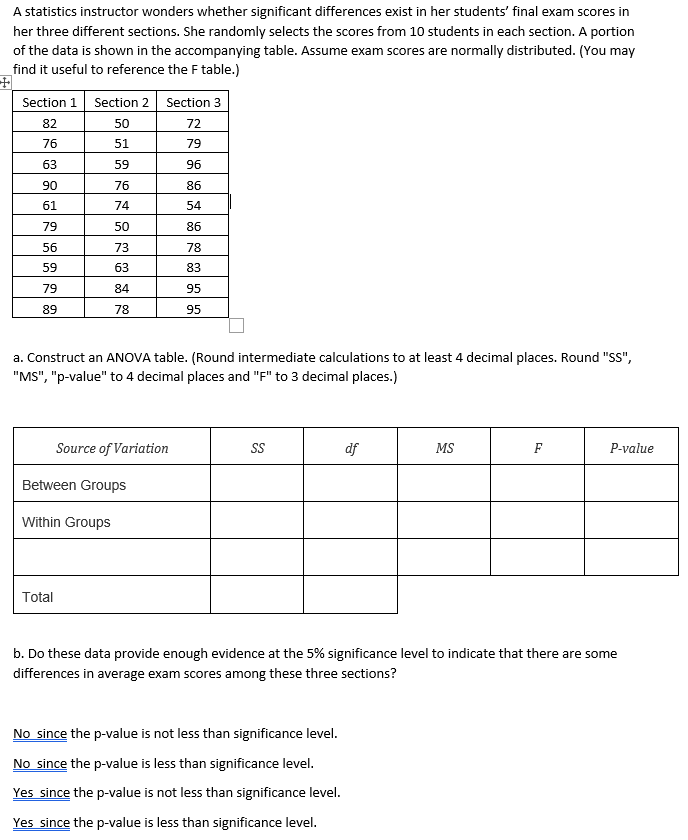
. statistics instructor wonders whether signicant differences exist in her students\" final exam scores in her three different sections. She randomlillr selects the scores from 10 students in each section. A portion of the data is shown in the acoon'ipa nving table. ssume exam scores are normally distributed. [You may.r nd it useful to reference the F table.] a. Construct an AN OVA table. {Round intermediate calculations to at least 4 decimal places. Round "55", "M5", "p-value" to 4 decimal places and "F" to 3 decimal places.) Behveen Groups Within Groups -- I]. Do these data provide enough evidence at the 5% signicance level to indicate that there are some differences in average exam scores among these three sections? No since the pvalue is not less than significance level. No since the pvalue is less than signicanoe level. Yes since the pvalue is not less than significance level. Yes since the pvalue is less than signicance level
Step by Step Solution
There are 3 Steps involved in it

Get step-by-step solutions from verified subject matter experts