

Question: A statistics instructor wonders whether significant differences exist in her students' average exam scores in her three different sections. She randomly selects the scores from
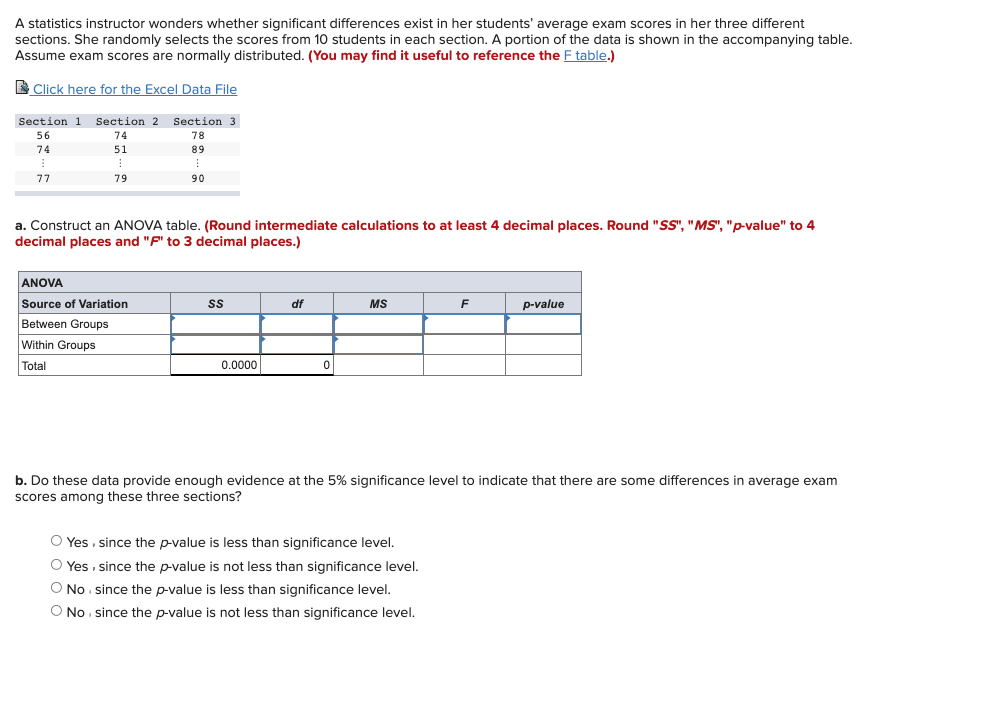
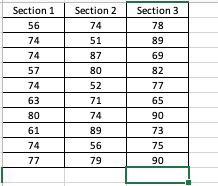


A statistics instructor wonders whether significant differences exist in her students' average exam scores in her three different sections. She randomly selects the scores from 10 students in each section. A portion of the data is shown in the accompanying table. Assume exam scores are normally distributed. (You may find it useful to reference the F table.) Click here for the Excel Data File Section 1 Section 2 Section 3 56 74 78 74 51 89 77 79 90 a. Construct an ANOVA table. (Round intermediate calculations to at least 4 decimal places. Round "SS", "MS", "p-value" to 4 decimal places and "F' to 3 decimal places.) ANOVA Source of Variation SS df MS F p-value Between Groups Within Groups Total 0.0000 0 b. Do these data provide enough evidence at the 5% significance level to indicate that there are some differences in average exam scores among these three sections? O Yes , since the p-value is less than significance level. O Yes , since the p-value is not less than significance level. O No . since the p-value is less than significance level. O No , since the p-value is not less than significance level.Section 1 Section 2 Section 3 56 74 78 74 51 89 74 87 69 57 80 82 74 52 77 63 71 65 80 74 90 61 89 73 74 56 75 77 79 90
Step by Step Solution
There are 3 Steps involved in it

Get step-by-step solutions from verified subject matter experts