

Question: A statistics instructor wonders whether significant differences exist in her students' final exam scores in her three different sections. She randomly selects the scores from
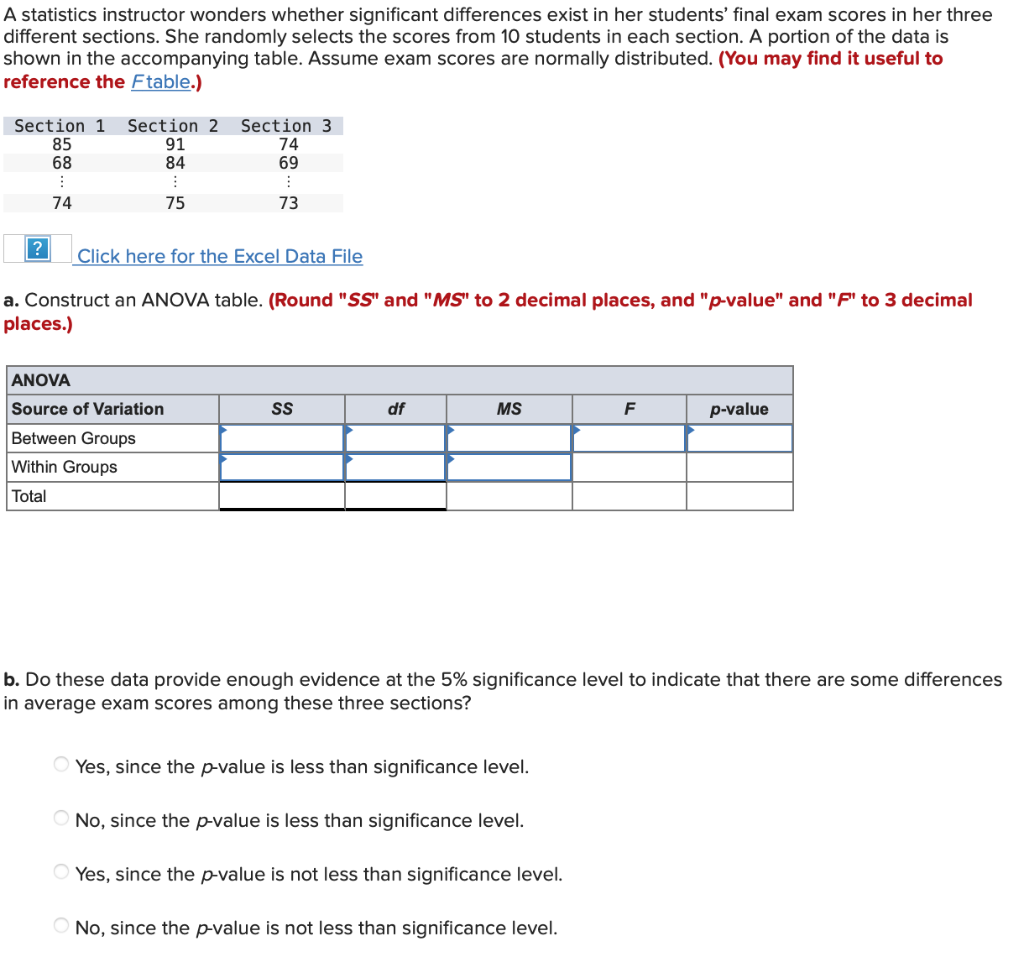
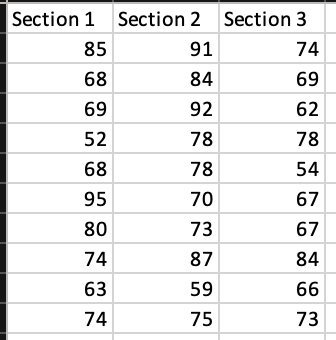
A statistics instructor wonders whether significant differences exist in her students' final exam scores in her three different sections. She randomly selects the scores from 10 students in each section. A portion of the data is shown in the accompanying table. Assume exam scores are normally distributed. (You may find it useful to reference the F table.) Click here for the Excel Data File a. Construct an ANOVA table. (Round "SS" and "MS" to 2 decimal places, and "p-value" and " F " to 3 decimal places.) b. Do these data provide enough evidence at the 5% significance level to indicate that there are some differences in average exam scores among these three sections? Yes, since the p-value is less than significance level. No, since the p-value is less than significance level. Yes, since the p-value is not less than significance level. No, since the p-value is not less than significance level. \begin{tabular}{|r|r|r|} \hline Section 1 & Section 2 & Section 3 \\ \hline 85 & 91 & 74 \\ \hline 68 & 84 & 69 \\ \hline 69 & 92 & 62 \\ \hline 52 & 78 & 78 \\ \hline 68 & 78 & 54 \\ \hline 95 & 70 & 67 \\ \hline 80 & 73 & 67 \\ \hline 74 & 87 & 84 \\ \hline 63 & 59 & 66 \\ \hline 74 & 75 & 73 \\ \hline \end{tabular}
Step by Step Solution
There are 3 Steps involved in it

Get step-by-step solutions from verified subject matter experts