

Question: A statistics professor wants to determine how students' final grades are related to the midterm exam grades and the number of classes missed. The
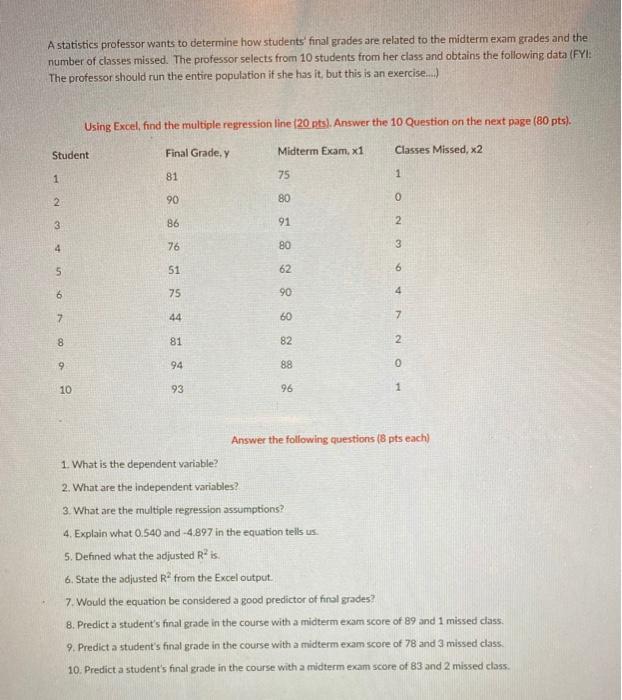
A statistics professor wants to determine how students' final grades are related to the midterm exam grades and the number of classes missed. The professor selects from 10 students from her class and obtains the following data (FYI: The professor should run the entire population if she has it, but this is an exercise....) Student 1 2 3 4 5 6 7 8 9 Using Excel, find the multiple regression line (20 pts). Answer the 10 Question on the next page (80 pts). Midterm Exam, x1 Classes Missed, x2 10 Final Grade, y 81 90 86 76 51 75 44 81 94 93 75 80 91 80 62 90 60 82 88 96 1 HON VAO W NO 2 3 6 4 7 2 0 1 Answer the following questions (8 pts each) 1. What is the dependent variable? 2. What are the independent variables? 3. What are the multiple regression assumptions? 4. Explain what 0.540 and -4.897 in the equation tells us 5. Defined what the adjusted R is. 6. State the adjusted R from the Excel output. 7. Would the equation be considered a good predictor of final grades? 8. Predict a student's final grade in the course with a midterm exam score of 89 and 1 missed class. and ssed class 9. Predict a student's final grade in the course with a midterm exam score of 10. Predict a student's final grade in the course with a midterm exam score of 83 and 2 missed class.
Step by Step Solution
3.55 Rating (152 Votes )
There are 3 Steps involved in it
1 What is the dependent variable The dependent variable in this case is the students final grade in the course denoted by y 2 What are the independent ... View full answer

Get step-by-step solutions from verified subject matter experts