

Question: A student wants to develop 3-sigma level variable control charts for the weight of firewood that comes in a box. Due to uneven shape of
- A student wants to develop 3-sigma level variable control charts for the weight of firewood that comes in a box. Due to uneven shape of wood, weight of box varies a lot. Draw X-bar chart and R-chart using the table below. For both charts, calculate and show UCL, CL and LCL. Discuss your results. Weight in pounds from four samplings with sample size of three (n=3) are:
Sampling 1 Sampling 2 Sampling 3 Sampling 4
18 38 22 26
26 30 28 20
26 26 26 26
- The number of weekly customer complaints are monitored in a hotel using a c-chart. Develop a 3-sigma level control chart using the data below. Calculate and show values for UCL, CL, LCL. Plot the sample data and make a conclusion. Is everything under control?
| week | 1 | 2 | 3 | 4 | 5 |
| # of complaint | 3 | 2 | 3 | 1 | 3 |
For below questions, choose the best answer.
3) A structured approach for integrating the voice of customers into both the product and service development process (capability) is:
- Quality Function Deployment
- Ishikawa diagram
- Design for Manufacturability
- Concurrent Engineering
- Lot tolerance Percent Defective
4) The probability of shipping a lot or batch of products whose proportion of defective items is greater than LTPD is called:
- Producer's risk
- Consumers risk
- Alpha
- Average outgoing quality limit
- AOQ
5) A P-chart is used to measure:
a) continuous improvement
b) desirable random variation
c) proportion of items in a sample that are defective
d) the count of defective parts
e) a breakthrough change
6) What process capability index (Cp) value implies that the process exceeds minimal capability?
a) 0
b)
c) = 1
d) > 1
e) 6s
7) Which of following is not a good element of Total Quality Management?
a) Top management leadership
b) Differentiation leadership
c) Process management
d) Human resource focus
e) Strategic planning
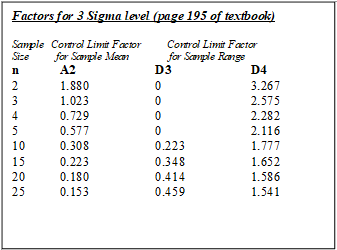
Factors for 3 Sigma level (page 195 of textbook) Sample Cortrol Limit Factor Size for Sample Macm n 2 1.880 3 1.023 4 0.729 5 0.577 10 0.308 15 0.223 20 0.180 25 0.153 Control Limit Factor for Sample Range D3 D4 0 3.267 0 2.575 0 2.282 0 2.116 0.223 1.777 0.348 1.652 0.414 1.586 0.459 1.541
Step by Step Solution
There are 3 Steps involved in it

Get step-by-step solutions from verified subject matter experts