

Question: A student wants to develop 3-sigma level variable control charts for the weight of firewood that comes in a box. Due to uneven shape of
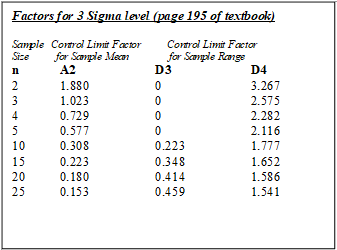
- A student wants to develop 3-sigma level variable control charts for the weight of firewood that comes in a box. Due to uneven shape of wood, weight of box varies a lot. Draw X-bar chart and R-chart using the table below. For both charts, calculate and show UCL, CL and LCL. Discuss your results. Weight in pounds from four samplings with sample size of three (n=3) are:
Sampling 1 Sampling 2 Sampling 3 Sampling 4
18 38 22 26
26 30 28 20
26 26 26 26
2. The number of weekly customer complaints are monitored in a hotel using a c-chart. Develop a 3-sigma level control chart using the data below. Calculate and show values for UCL, CL, LCL. Plot the sample data and make a conclusion. Is everything under control?
| week | 1 | 2 | 3 | 4 | 5 |
| # of complaint | 3 | 2 | 3 | 1 | 3 |
Step by Step Solution
There are 3 Steps involved in it
1 Expert Approved Answer
Step: 1 Unlock

Question Has Been Solved by an Expert!
Get step-by-step solutions from verified subject matter experts
Step: 2 Unlock
Step: 3 Unlock