

Question: A student was asked to draw an aggregate demand and aggregate supply graph to illustrate the effect of an increase in aggregate supply. The student
A student was asked to draw an aggregate demand and aggregate supply graph to illustrate the effect of an increase in aggregate supply. The student drew the following graph:
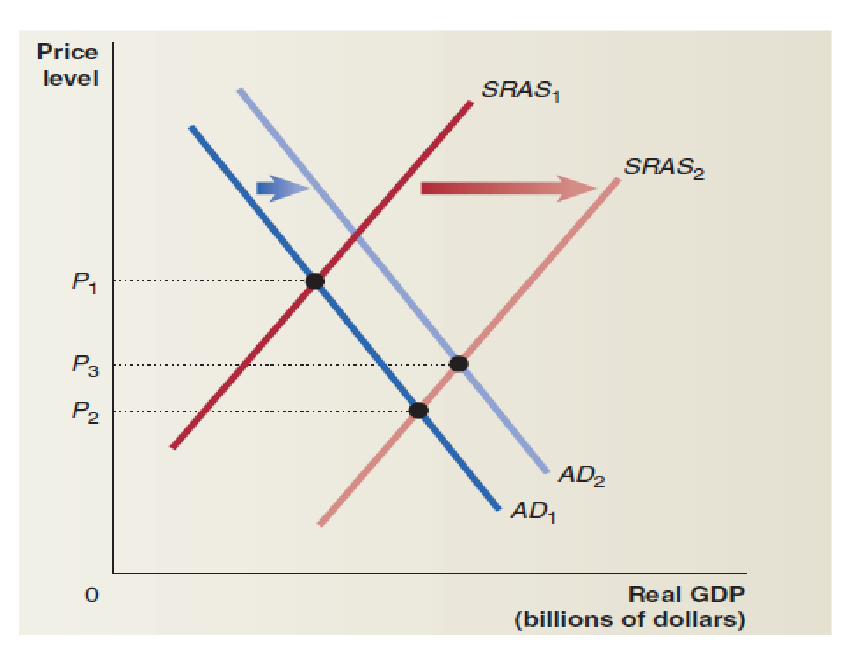
Price SRAS level SRAS2 P1 P3 P2 AD2 AD Real GDP (billions of dollars)
Step by Step Solution
There are 3 Steps involved in it
1 Expert Approved Answer
Step: 1 Unlock

Question Has Been Solved by an Expert!
Get step-by-step solutions from verified subject matter experts
Step: 2 Unlock
Step: 3 Unlock