

Question: A study on comparing two population means. The two samples mean, standard deviations and sample sizes are given below: First sample Second sample Size
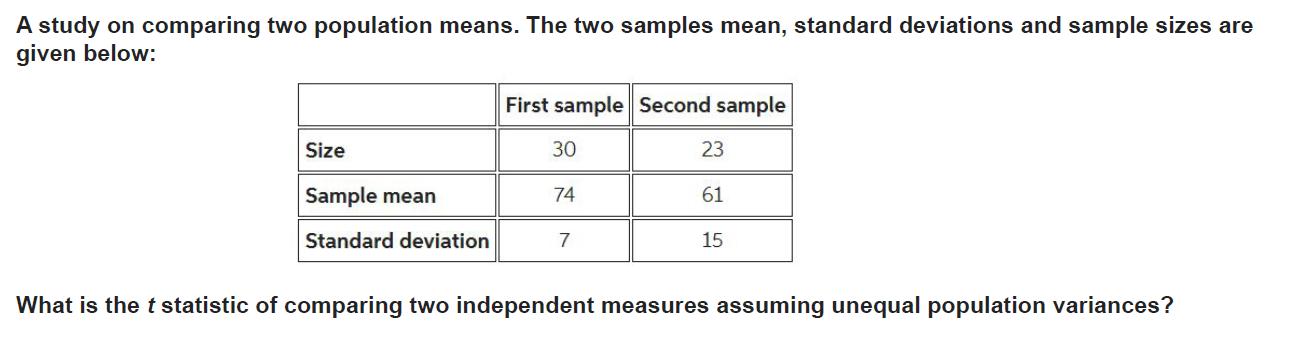
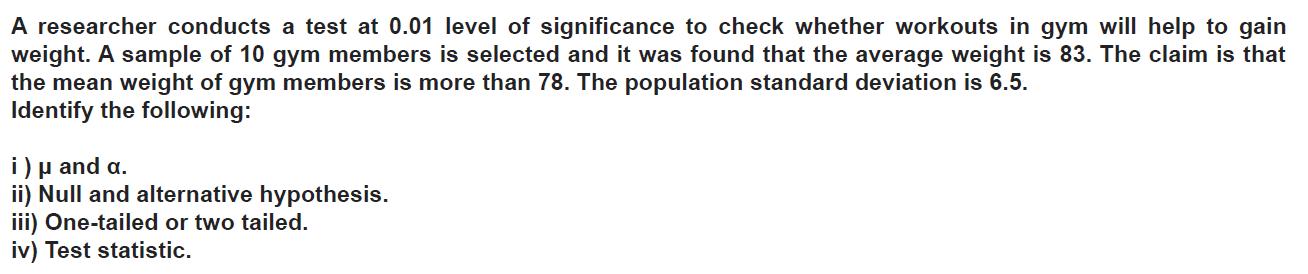

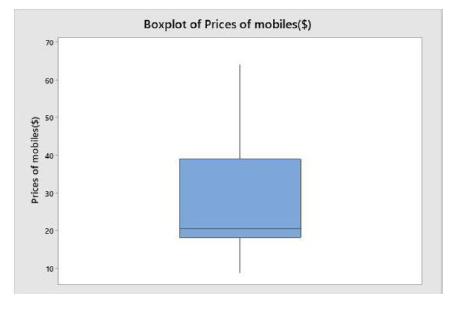
A study on comparing two population means. The two samples mean, standard deviations and sample sizes are given below: First sample Second sample Size 30 23 Sample mean 74 61 Standard deviation 7 15 What is the t statistic of comparing two independent measures assuming unequal population variances? A researcher conducts a test at 0.01 level of significance to check whether workouts in gym will help to gain weight. A sample of 10 gym members is selected and it was found that the average weight is 83. The claim is that the mean weight of gym members is more than 78. The population standard deviation is 6.5. Identify the following: i) and a. ii) Null and alternative hypothesis. iii) One-tailed or two tailed. iv) Test statistic. Consider the boxplot based on the prices of mobiles in different shops. Find the five number summary based on the boxplot. Prices of mobiles($) 10 20 30 50 70 Boxplot of Prices of mobiles($)
Step by Step Solution
There are 3 Steps involved in it

Get step-by-step solutions from verified subject matter experts