

Question: A supplier financial analysis is likely whenever a purchaser is attempting to reduce a pool of potential supply sources. If a supplier does not meet
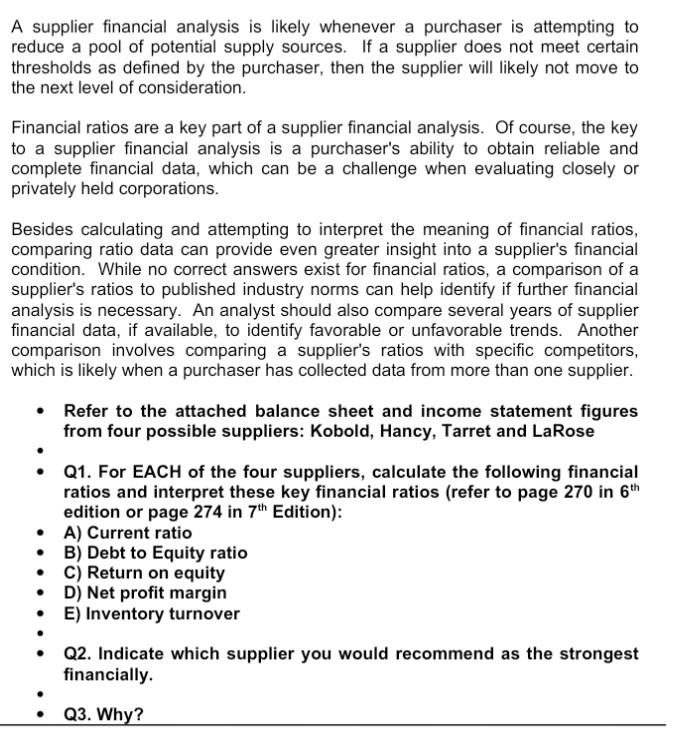
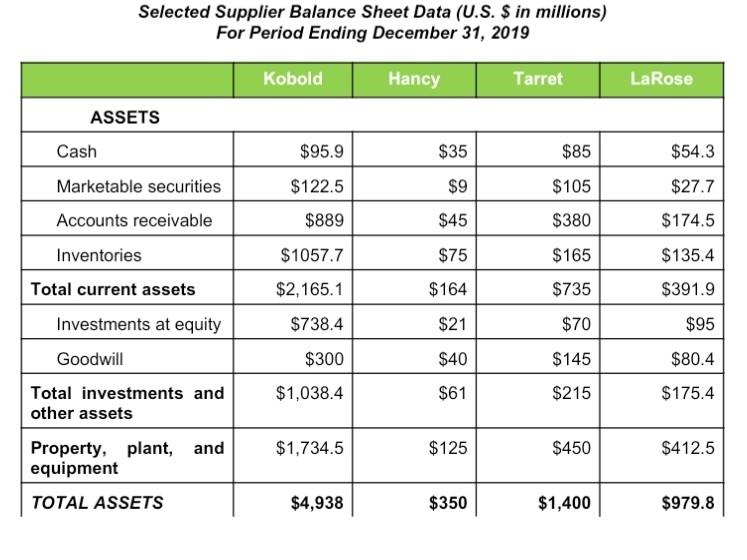
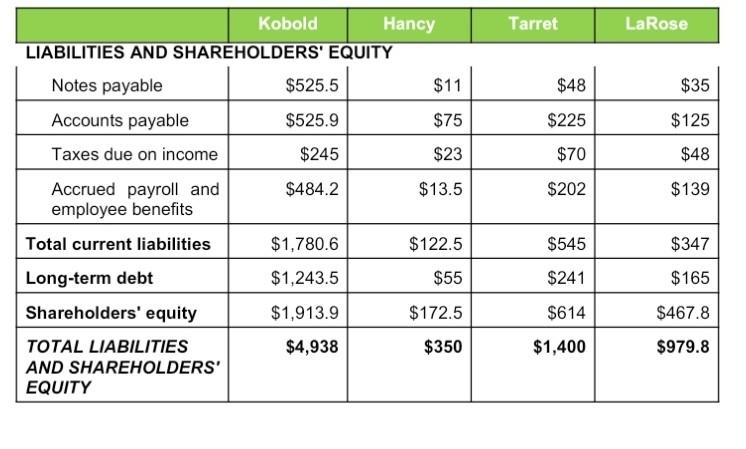
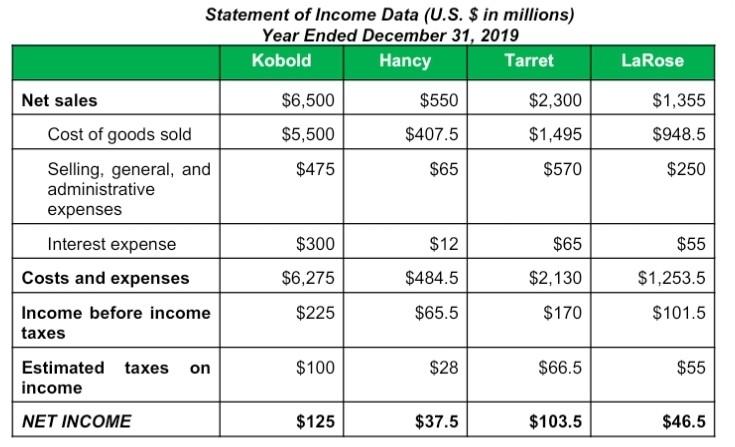
A supplier financial analysis is likely whenever a purchaser is attempting to reduce a pool of potential supply sources. If a supplier does not meet certain thresholds as defined by the purchaser, then the supplier will likely not move to the next level of consideration. Financial ratios are a key part of a supplier financial analysis. Of course, the key to a supplier financial analysis is a purchaser's ability to obtain reliable and complete financial data, which can be a challenge when evaluating closely or privately held corporations. Besides calculating and attempting to interpret the meaning of financial ratios, comparing ratio data can provide even greater insight into a supplier's financial condition. While no correct answers exist for financial ratios, a comparison of a supplier's ratios to published industry norms can help identify if further financial analysis is necessary. An analyst should also compare several years of supplier financial data, if available, to identify favorable or unfavorable trends. Another comparison involves comparing a supplier's ratios with specific competitors, which is likely when a purchaser has collected data from more than one supplier. Refer to the attached balance sheet and income statement figures from four possible suppliers: Kobold, Hancy, Tarret and LaRose Q1. For EACH of the four suppliers, calculate the following financial ratios and interpret these key financial ratios (refer to page 270 in 6th edition or page 274 in 7th Edition): A) Current ratio B) Debt to Equity ratio C) Return on equity D) Net profit margin E) Inventory turnover . Q2. Indicate which supplier you would recommend as the strongest financially Q3. Why? Selected Supplier Balance Sheet Data (U.S. $ in millions) For Period Ending December 31, 2019 Kobold Hancy Tarret LaRose ASSETS Cash $95.9 $35 $85 $54.3 $122.5 $9 $105 $27.7 $889 $45 $380 $174.5 $1057.7 $75 $165 $135.4 Marketable securities Accounts receivable Inventories Total current assets Investments at equity Goodwill $2,165.1 $164 $735 $391.9 $738.4 $21 $70 $95 $300 $40 $145 $80.4 $1,038.4 $61 $215 Total investments and other assets $175.4 $1,734.5 $125 Property, plant, and equipment $450 $412.5 TOTAL ASSETS $4,938 $350 $1,400 $979.8 Tarret LaRose $48 $35 $225 $125 $70 $48 $202 $139 Kobold Hancy LIABILITIES AND SHAREHOLDERS' EQUITY Notes payable $525.5 $11 Accounts payable $525.9 $75 Taxes due on income $245 $23 Accrued payroll and $484.2 $13.5 employee benefits Total current liabilities $1,780.6 $122.5 Long-term debt $1,243.5 $55 Shareholders' equity $1,913.9 $172.5 TOTAL LIABILITIES $4,938 $350 AND SHAREHOLDERS' EQUITY $545 $347 $241 $165 $614 $467.8 $1,400 $979.8 Statement of Income Data (U.S. $ in millions) Year Ended December 31, 2019 Kobold Hancy Tarret LaRose $550 $2,300 $1,355 $6,500 $5,500 $407.5 $1,495 $948.5 Net sales Cost of goods sold Selling, general, and administrative expenses $475 $65 $570 $250 Interest expense $300 $12 $65 $55 Costs and expenses $6,275 $484.5 $2,130 $1,253.5 $225 $65.5 $170 Income before income taxes $101.5 Estimated taxes on income $100 $28 $66.5 $55 NET INCOME $125 $37.5 $103.5 $46.5
Step by Step Solution
There are 3 Steps involved in it
1 Expert Approved Answer
Step: 1 Unlock

Question Has Been Solved by an Expert!
Get step-by-step solutions from verified subject matter experts
Step: 2 Unlock
Step: 3 Unlock