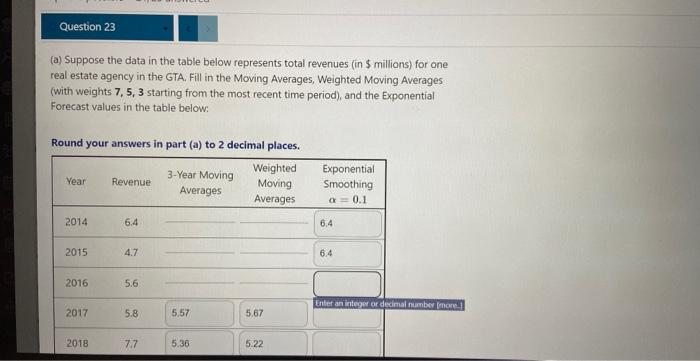
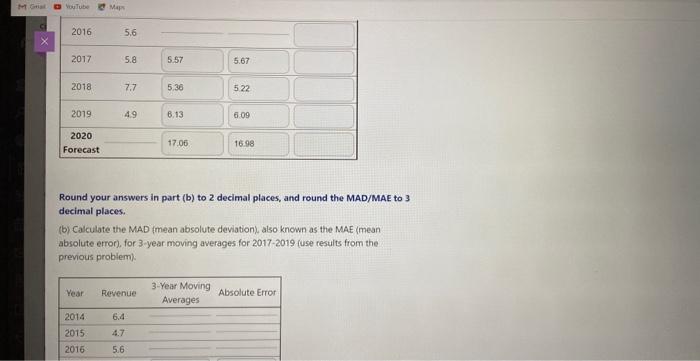
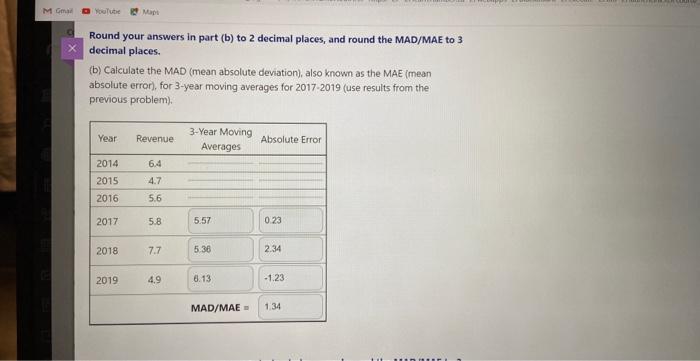
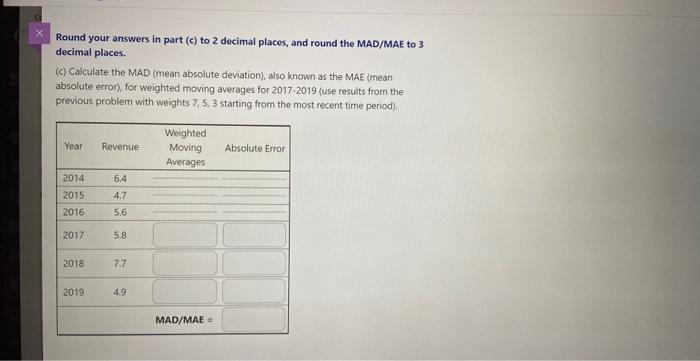
Question: (a) Suppose the data in the table below represents total revenues (in $ millions) for one real estate agency in the GTA. Fill in the

(a) Suppose the data in the table below
(a) Suppose the data in the table below represents total revenues (in $ millions) for one real estate agency in the GTA. Fill in the Moving Averages, Weighted Moving Averages (with weights 7,5,3 starting from the most recent time period), and the Exponential Forecast values in the table below: Round your answers in part (a) to 2 decimal places. Round your answers in part (b) to 2 decimal places, and round the MAD/MAE to 3 decimal places. (b) Calculate the MAD (mean absolute deviation) also known as the MAE imean absolute error), for 3 -year moving averages for 20172019 (use results from the previous problem): Round your answers in part (b) to 2 decimal places, and round the MAD/MAE to 3 decimal places. (b) Calculate the MAD (mean absolute deviation), also known as the MAE imean absolute error), for 3-year moving averages for 20172019 (use results from the previous problem). Round your answers in part (c) to 2 decimal places, and round the MAD/MAE to 3 decimal places. (c) Calculate the MAD (mean absolute deviation), aiso known as the MAE (mean absolute error), for weighted moving averages for 20172019 (use results from the previous problem with weights 7,5,3 starting from the most recent time period)

Step by Step Solution

There are 3 Steps involved in it

1 Expert Approved Answer
Step: 1 Unlock blur-text-image
Question Has Been Solved by an Expert!

Get step-by-step solutions from verified subject matter experts

Step: 2 Unlock
Step: 3 Unlock

Students Have Also Explored These Related General Management Questions!