

Question: Question 1 (a) Suppose the data in the table below represents total revenues (in $ millions) for one real estate agency in the GTA. Fill
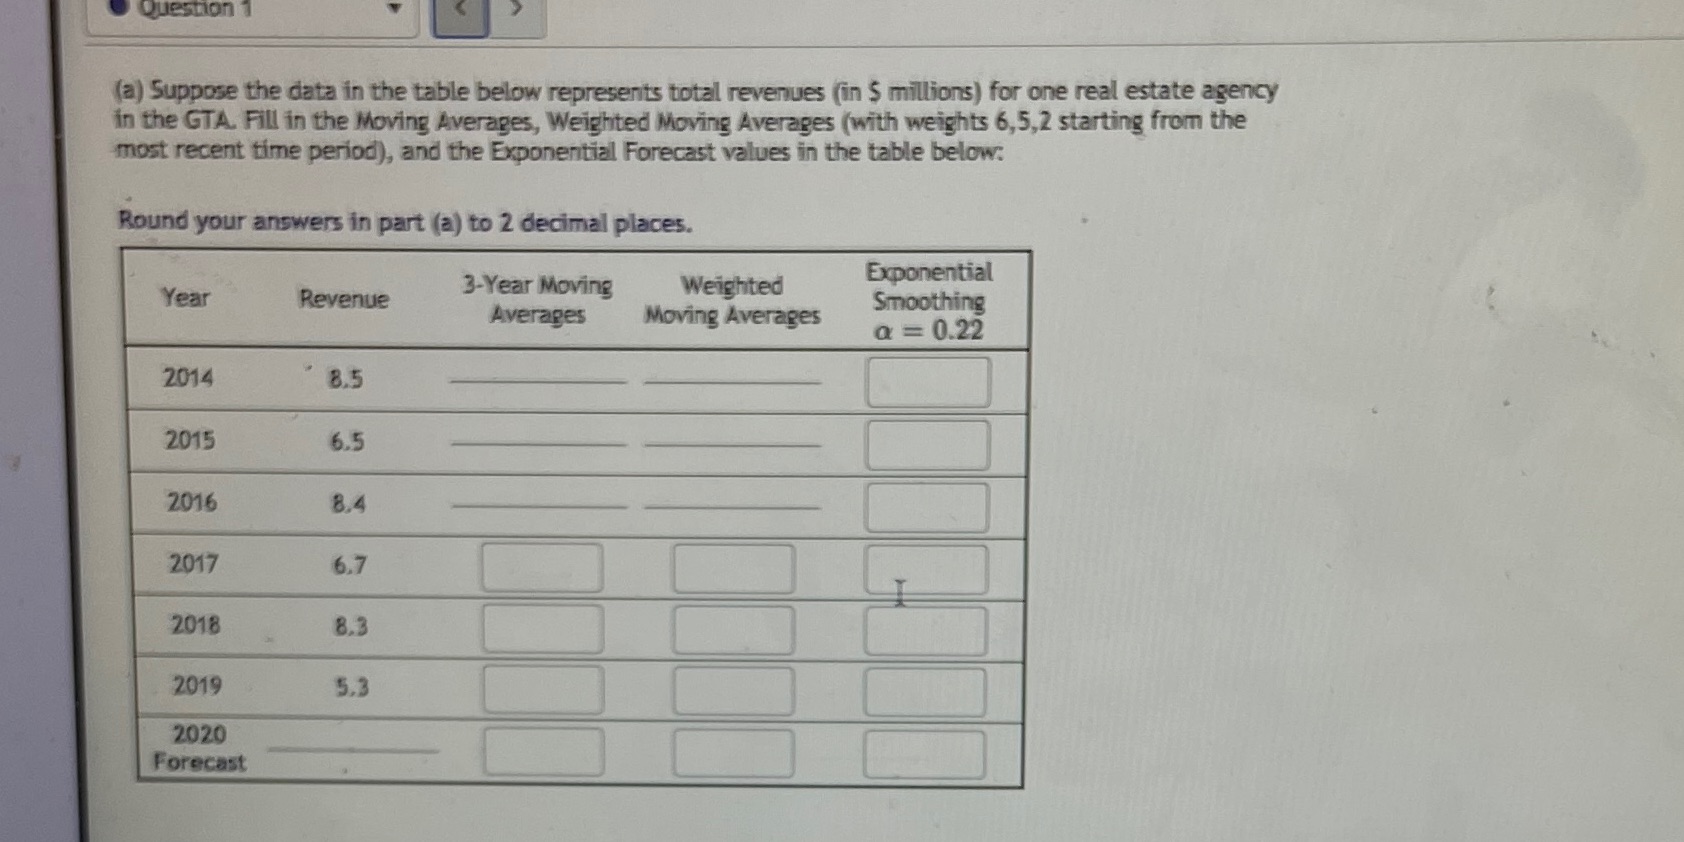
Question 1 (a) Suppose the data in the table below represents total revenues (in $ millions) for one real estate agency in the GTA. Fill in the Moving Averages, Weighted Moving Averages (with weights 6,5,2 starting from the most recent time period), and the Exponential Forecast values in the table below: Round your answers in part (a) to 2 decimal places. 3-Year Moving Weighted Exponential Year Revenue Moving Averages Smoothing Averages a = 0.22 2014 8.5 2015 6.5 2016 8.4 2017 6.7 2018 8.3 2019 5.3 2020 Forecast
Step by Step Solution
There are 3 Steps involved in it
1 Expert Approved Answer
Step: 1 Unlock

Question Has Been Solved by an Expert!
Get step-by-step solutions from verified subject matter experts
Step: 2 Unlock
Step: 3 Unlock