

Question: a. The network diagram for a project is shown in the accompanying figure, with three time estimates for each activity. Activity times are in months.
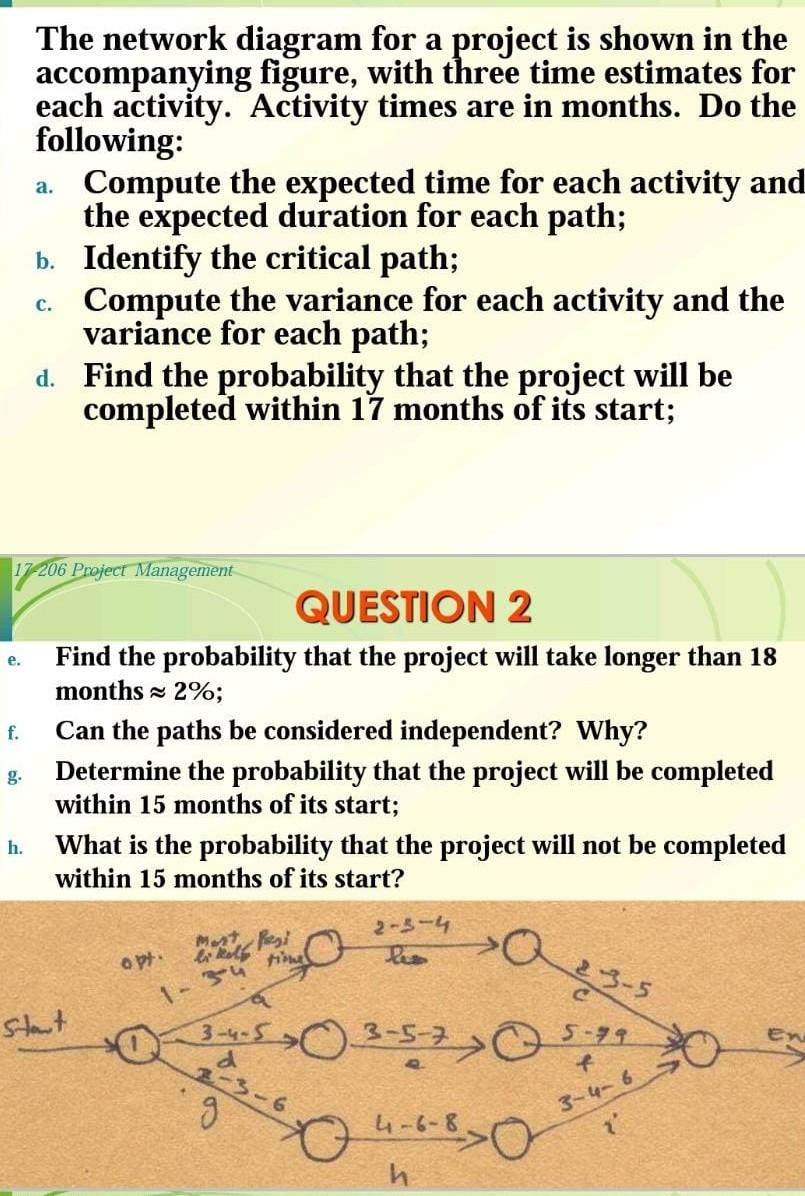
a. The network diagram for a project is shown in the accompanying figure, with three time estimates for each activity. Activity times are in months. Do the following: Compute the expected time for each activity and the expected duration for each path; b. Identify the critical path; Compute the variance for each activity and the variance for each path; d. Find the probability that the project will be completed within 17 months of its start; C. e. f. 17206 Project Management QUESTION 2 Find the probability that the project will take longer than 18 months ~ 2%; Can the paths be considered independent? Why? Determine the probability that the project will be completed within 15 months of its start; What is the probability that the project will not be completed within 15 months of its start? h. 2-3-4 Opt. Hists 34 1 - Start 3-4-5 03-575.29 30 en 2-3-6 9 3-4-6 4-6-8 h -870
Step by Step Solution
There are 3 Steps involved in it
1 Expert Approved Answer
Step: 1 Unlock

Question Has Been Solved by an Expert!
Get step-by-step solutions from verified subject matter experts
Step: 2 Unlock
Step: 3 Unlock