

Question: b ) The network diagram for a project is shown in the accompanying figures in table 2 below, with three time estimates for each activity.
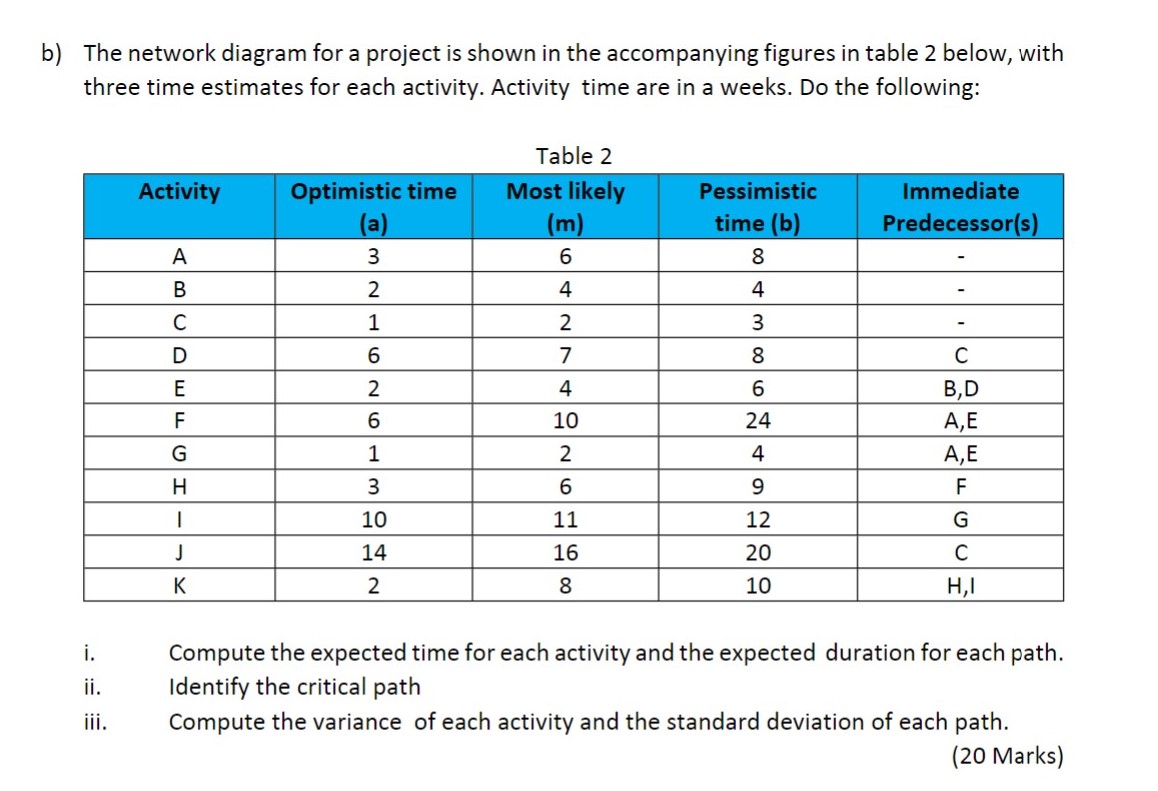
b The network diagram for a project is shown in the accompanying figures in table below, with three time estimates for each activity. Activity time are in a weeks. Do the following:
Table
tableActivitytableOptimistic timeatableMost likelymtablePessimistictime btableImmediatePredecessorsABCDCEBDFAEGAEHFIGJCKHI
i Compute the expected time for each activity and the expected duration for each path.
ii Identify the critical path
iii. Compute the variance of each activity and the standard deviation of each path.
Marks
Step by Step Solution
There are 3 Steps involved in it
1 Expert Approved Answer
Step: 1 Unlock

Question Has Been Solved by an Expert!
Get step-by-step solutions from verified subject matter experts
Step: 2 Unlock
Step: 3 Unlock