

Question: QUESTION 2 The network diagram for a project is shown in the accompanying figure, with three time estimates for each activity. Activity times are in

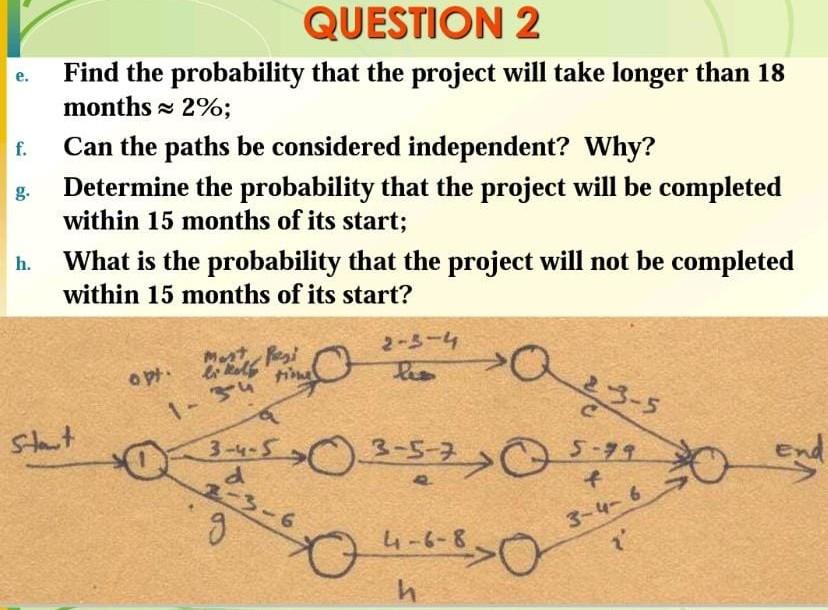
QUESTION 2 The network diagram for a project is shown in the accompanying figure, with three time estimates for each activity. Activity times are in months. Do the following: f. QUESTION 2 Find the probability that the project will take longer than 18 months 2%; = ; Can the paths be considered independent? Why? Determine the probability that the project will be completed within 15 months of its start; What is the probability that the project will not be completed within 15 months of its start? 2-3-4 most pesi li Real ti opt. O 3-5 1 - 304 Start 53-3 -- 3 3-5-7 end d 2 g 4-6-8 3-4-6 2 h
Step by Step Solution
There are 3 Steps involved in it
1 Expert Approved Answer
Step: 1 Unlock

Question Has Been Solved by an Expert!
Get step-by-step solutions from verified subject matter experts
Step: 2 Unlock
Step: 3 Unlock