

Question: a. The table below summarizes data on houses available for sale in threeMid-Atlantic states (NY , NJ, and PA). The table shows the mean and
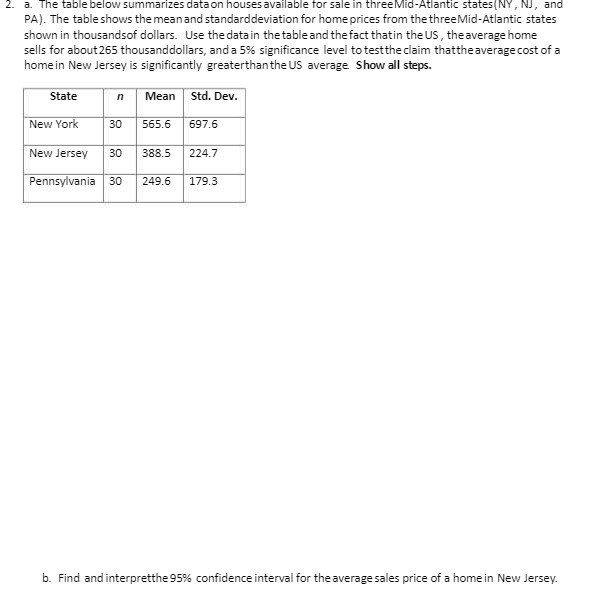
a. The table below summarizes data on houses available for sale in threeMid-Atlantic states (NY , NJ, and PA). The table shows the mean and standarddeviation for home prices from the threeMid-Atlantic states shown in thousandsof dollars. Use the data in the table and the fact thatin the US, theaverage home sells for about 265 thousanddollars, and a 5% significance level to test the claim that the average cost of a home in New Jersey is significantly greaterthan the US average Show all steps. State n Mean Std. Dev. New York 30 565.6 697.6 New Jersey 30 388.5 224.7 Pennsylvania 30 249.6 179.3 b. Find and interpretthe 95% confidence interval for the average sales price of a home in New Jersey
Step by Step Solution
There are 3 Steps involved in it

Get step-by-step solutions from verified subject matter experts