

Question: Find and interpret a 95% confidence interval for the difference in mean housing price between New York and New Jersey. Refer to the dataset Homes
Refer to the dataset Homes For Sale, which has data on houses available for sale in three Mid-Atlantic states (NY, NJ, and PA) as well as California (CA). Table 6.17 has summary statistics for each of the four states, with prices given in thousands of dollars. (Since n = 30, we ask you to use the t-distribution here despite the fact that the data are quite skewed. In practice, we might have enough concern about the skewness to choose to use bootstrap methods instead.)
Table 6.17
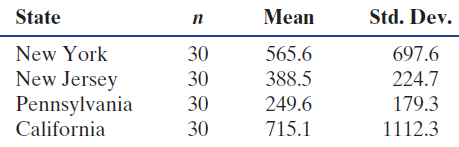
Mean Std. Dev. State New York New Jersey Pennsylvania California 30 565.6 697.6 30 388.5 224.7 179.3 1112.3 30 249.6 715.1 30
Step by Step Solution
3.54 Rating (168 Votes )
There are 3 Steps involved in it
For the difference in mean home price between New York and New Jersey we use ... View full answer

Get step-by-step solutions from verified subject matter experts