

Question: A tracer experiment for a packed bed reactor obtained the data listed below. Using these data plot the Exit Age Function and the F curve
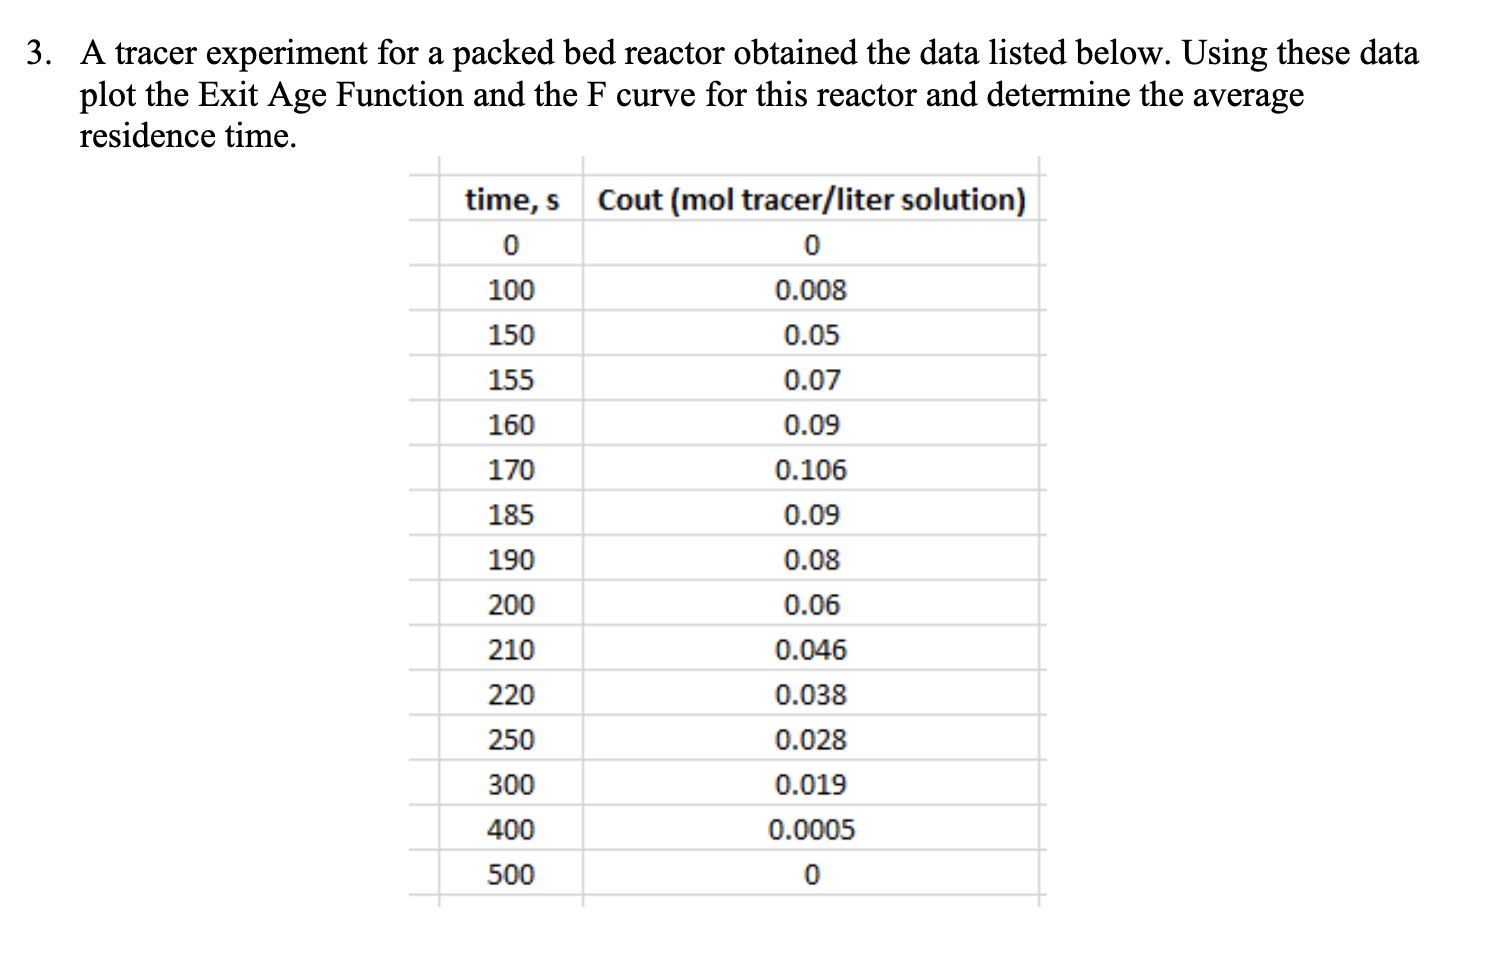
A tracer experiment for a packed bed reactor obtained the data listed below. Using these data plot the Exit Age Function and the F curve for this reactor and determine the average residence time.
tabletime sCout mol tracerliter solution
Step by Step Solution
There are 3 Steps involved in it
1 Expert Approved Answer
Step: 1 Unlock

Question Has Been Solved by an Expert!
Get step-by-step solutions from verified subject matter experts
Step: 2 Unlock
Step: 3 Unlock