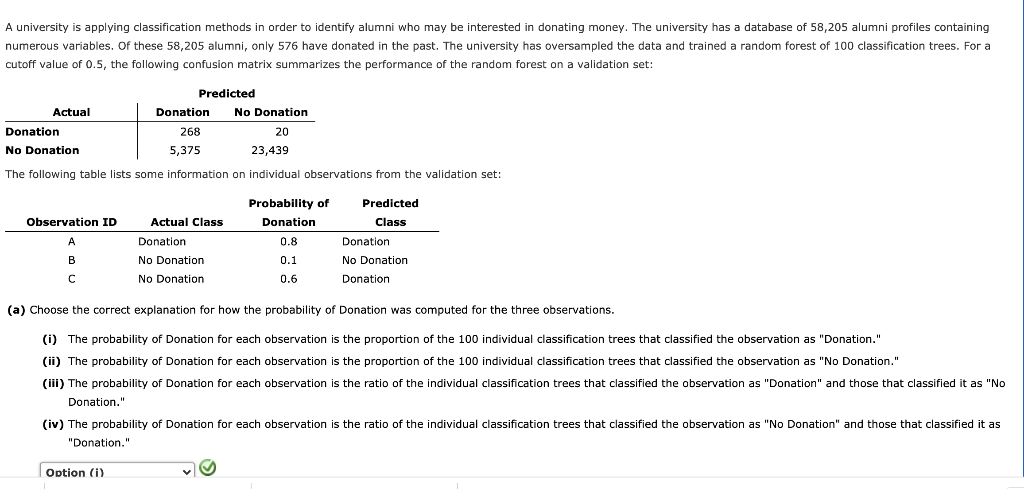
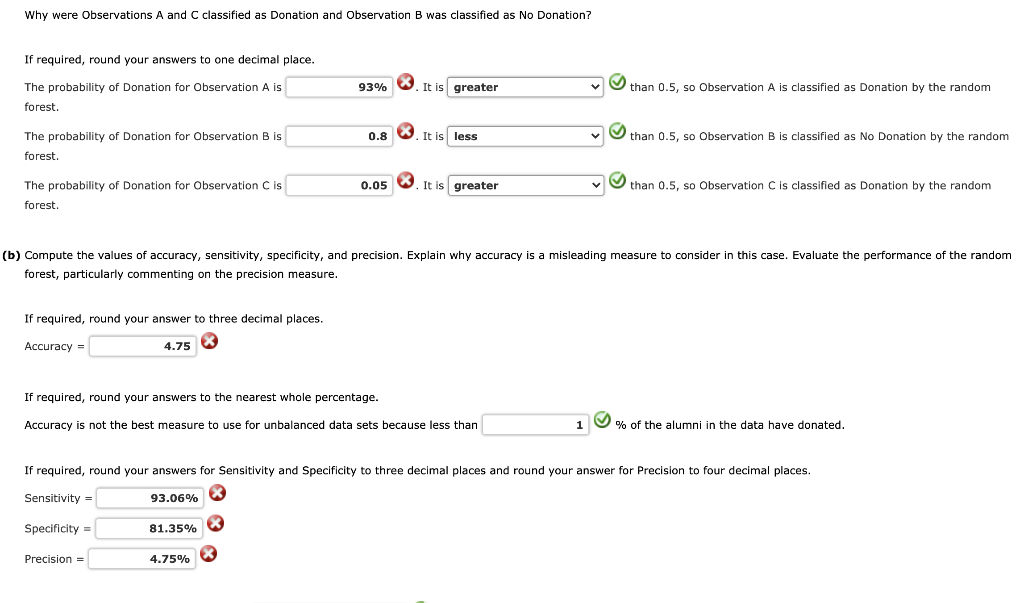
Question: A university is applying classification methods in order to identify alumni who may be interested in donating money. The university has a database of 58,205

A university is applying classification methodsA university is applying classification methods

A university is applying classification methods in order to identify alumni who may be interested in donating money. The university has a database of 58,205 alumni profiles containing numerous variables. Of these 58,205 alumni, only 576 have donated in the past. The university has oversampled the data and trained a random forest of 100 classification trees. For a cutoff value of 0.5, the following confusion matrix summarizes the performance of the random forest on a validation set: Actual Donation No Donation Predicted Donation No Donation 268 20 5,375 23,439 The following table lists some information on individual observations from the validation set: Observation ID Actual Class Probability of Donation 0.8 0.1 Donation No Donation Predicted Class Donation No Donation Donation B No Donation 0.6 (a) Choose the correct explanation for how the probability of Donation was computed for the three observations. (i) The probability of Donation for each observation is the proportion of the 100 individual classification trees that classified the observation as "Donation." (ii) The probability of Donation for each observation is the proportion of the 100 individual classification trees that classified the observation as "No Donation." (iii) The probability of Donation for each observation is the ratio of the individual classification trees that classified the observation as "Donation" and those that classified it as "No Donation." (iv) The probability of Donation for each observation is the ratio of the individual classification trees that classified the observation as "No Donation" and those that classified it as "Donation." Option (i) Why were Observations A and C classified as Donation and Observation B was classified as No Donation? If required, round your answers to one decimal place. 93% It is greater than 0.5, so Observation A is classified as Donation by the random The probability of Donation for Observation A is forest. 0.8 It is less than 0.5, so Observation B is classified as No Donation by the random The probability of Donation for Observation B is forest 0.05 It is greater than 0.5, so Observation C is classified as Donation by the random The probability of Donation for Observation C is forest. (b) Compute the values of accuracy, sensitivity, specificity, and precision. Explain why accuracy is a misleading measure to consider in this case. Evaluate the performance of the random forest, particularly commenting on the precision measure. If required, round your answer to three decimal places. Accuracy = 4.75 If required, round your answers to the nearest whole percentage. Accuracy is not the best measure to use for unbalanced data sets because less than % of the alumni in the data have donated. If required, round your answers for Sensitivity and Specificity to three decimal places and round your answer for Precision to four decimal places. Sensitivity = 93.06% Specificity = 81.35% Precision = 4.75%

Step by Step Solution

There are 3 Steps involved in it

1 Expert Approved Answer
Step: 1 Unlock blur-text-image
Question Has Been Solved by an Expert!

Get step-by-step solutions from verified subject matter experts

Step: 2 Unlock
Step: 3 Unlock

Students Have Also Explored These Related General Management Questions!