

Question: A university is applying classification methods in order to identify alumni who may be interested in donating money. The university has a database of
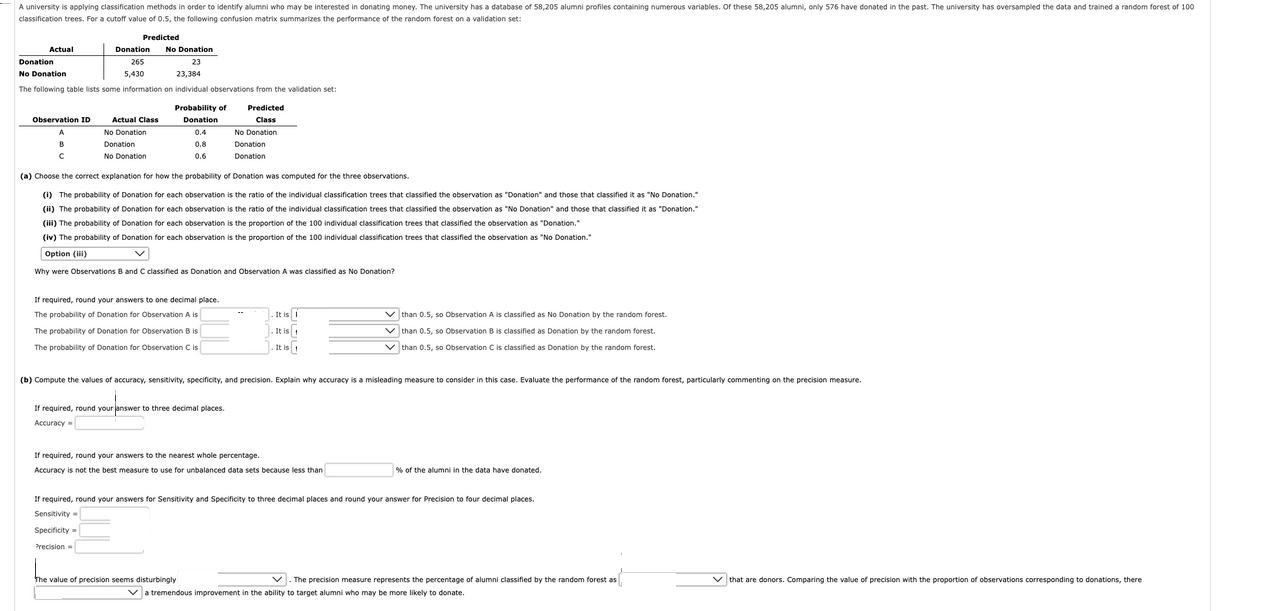
A university is applying classification methods in order to identify alumni who may be interested in donating money. The university has a database of 58,205 alumni profiles containing numerous variables. Of these 58,205 alumni, only 576 have donated in the past. The university has oversampled the data and trained a random forest of 100 classification trees. For a cutoff value of 0.5, the following confusion matrix summarizes the performance of the random forest on a validation set: Actual Donation No Donation 23 23,384 No Donation The following table lists some information on individual observations from the validation set: Predicted Donation 265 5,430 Observation ID Probability of Donation 0.4 0.8 No Donation. Donation Donation 0.6 (a) Choose the correct explanation for how the probability of Donation was computed for the three observations. (i) The probability of Donation for each observation is the ratio of the individual classification trees that classified the observation as "Donation" and those that classified it as "No Donation." (ii) The probability of Donation for each observation is the ratio of the individual classification trees that classified the observation as "No Donation and those that classified it as "Donation." (iii) The probability of Donation for each observation is the proportion of the 100 individual classification trees that classified the observation as "Donation." (iv) The probability of Donation for each observation is the proportion of the 100 individual classification trees that classified the observation as "No Donation." Option () v Why were Observations B and C classified as Donation and Observation A was classified as No Donation? Actual Class No Donation Donation No Donation If required, round your answers to one decimal place The probability of Donation for Observation A is The probability of Donation for Observation B is The probability of Donation for Observation C is If required, round your answer to three decimal places. Accuracy Predicted Class It is i It is It is 1 (b) Compute the values of accuracy, sensitivity, specificity, and precision. Explain why accuracy is a misleading measure to consider in this case. Evaluate the performance of the random forest, particularly commenting on the precision measure. If required, round your answers to the nearest whole percentage. Accuracy is not the best measure to use for unbalanced data sets because less than The value of precision seems disturbingly than 0.5, so Observation A is classified as No Donation by the random forest. than 0.5, so Observation 8 is classified as Donation by the random forest. than 0.5, so Observation C is classified as Donation by the random forest. % of the alumni in the data have donated. If required, round your answers for Sensitivity and Specificity to three decimal places and round your answer for Precision to four decimal places. Sensitivity Specificity Precision The precision measure represents the percentage of alumni classified by the random forest as Va tremendous improvement in the ability to target alumni who may be more likely to donate. that are donors. Comparing the value of precision with the proportion of observations corresponding to donations, there
Step by Step Solution
3.37 Rating (150 Votes )
There are 3 Steps involved in it
ANSWER a The correct explanation for how the probability of Donation was computed for the three observations is 3 The probability of Donation for each ... View full answer

Get step-by-step solutions from verified subject matter experts