

Question: a. Use a spreadsheet (or a calculator with a linear regression function) to determine stock X 's beta coefficient. Do not round intermediate caiculations. Reund
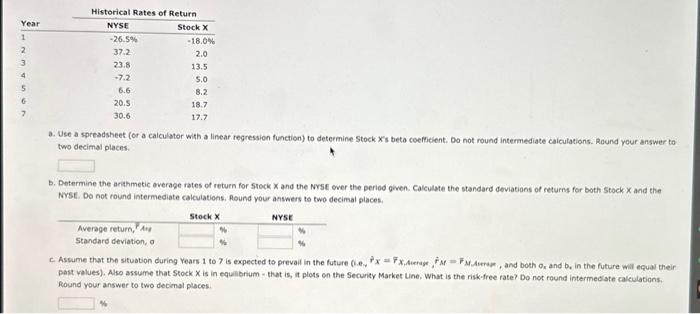
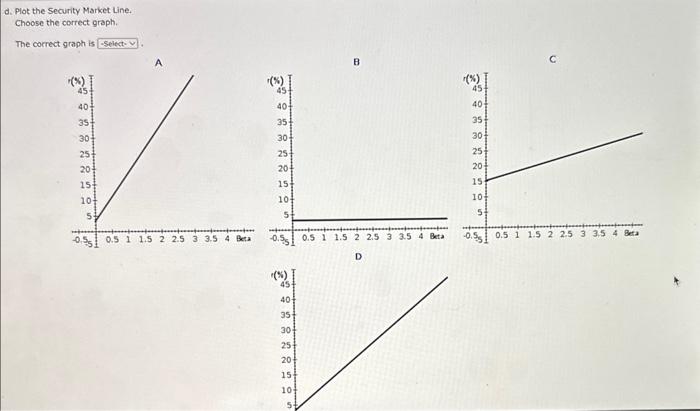
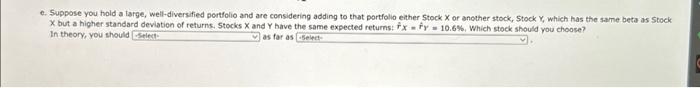
a. Use a spreadsheet (or a calculator with a linear regression function) to determine stock X 's beta coefficient. Do not round intermediate caiculations. Reund your answer to two decimal places. b. Dotermine the arithmetic average rates of return for snock x and the Nyst ever the period given. Calculate the standard deviations of returns for both Stock x and the Nrse. Do not round intermediate calculations, Round your answers to two decimal places. past volues). Also assume that Stock X is in equibrium - that is, it plots on the Security Market Line. What is the risk-free rate? Do not round intermediate calculations. Round your answer to two decimal places. d. Plot the Security Market Line. Choose the correct graph. The coerect graph is e. Suppose you hold a targe, weil-diversified portfolio and are considering adding to that portfolio either stock X or another stock, Stock x, which has the same beta as Stock. X but a higher standard deviation of returns. Stocks X and Y have the same expected returnst rx=r^y=10.6%. Which stack should you choose? In theory, you should as tar as a. Use a spreadsheet (or a calculator with a linear regression function) to determine stock X 's beta coefficient. Do not round intermediate caiculations. Reund your answer to two decimal places. b. Dotermine the arithmetic average rates of return for snock x and the Nyst ever the period given. Calculate the standard deviations of returns for both Stock x and the Nrse. Do not round intermediate calculations, Round your answers to two decimal places. past volues). Also assume that Stock X is in equibrium - that is, it plots on the Security Market Line. What is the risk-free rate? Do not round intermediate calculations. Round your answer to two decimal places. d. Plot the Security Market Line. Choose the correct graph. The coerect graph is e. Suppose you hold a targe, weil-diversified portfolio and are considering adding to that portfolio either stock X or another stock, Stock x, which has the same beta as Stock. X but a higher standard deviation of returns. Stocks X and Y have the same expected returnst rx=r^y=10.6%. Which stack should you choose? In theory, you should as tar as
Step by Step Solution
There are 3 Steps involved in it

Get step-by-step solutions from verified subject matter experts