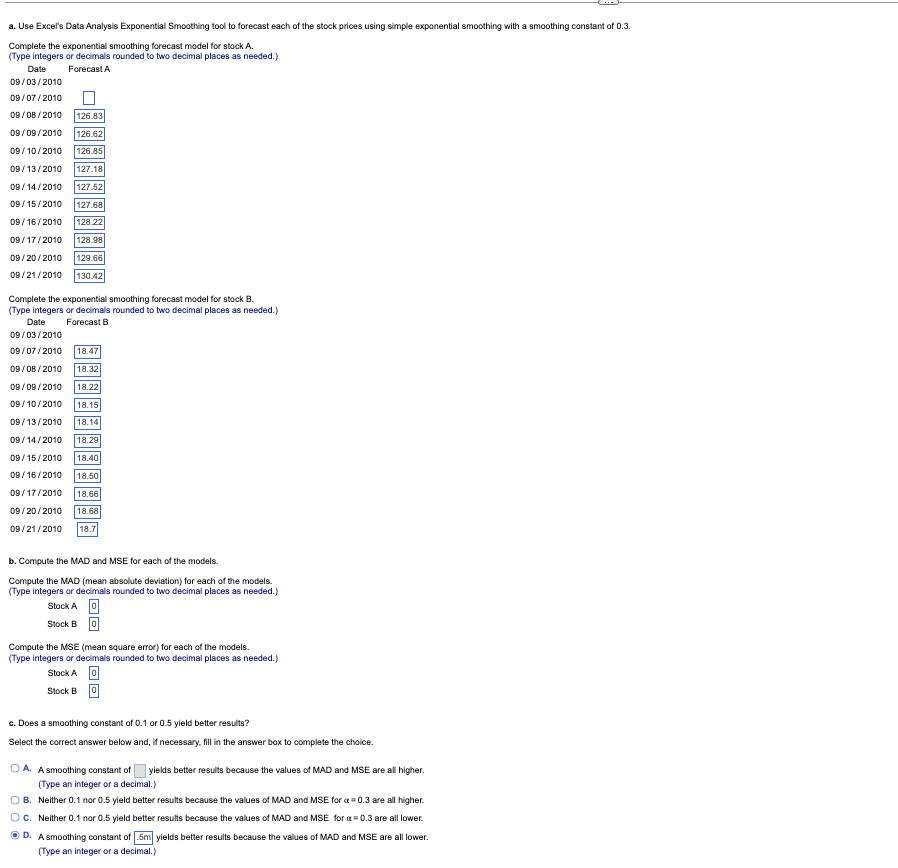
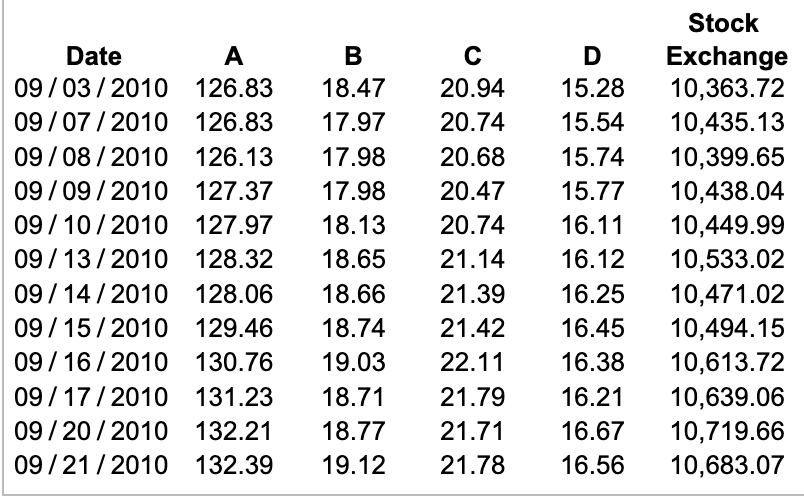
Question: a. Use Excel's Data Analysis Exponential Smoothing tool to forecast each of the stock prices using simple exponential smoothing with a smoothing constant of 0.3.

a. Use Excel's Data Analysis Exponentiala. Use Excel's Data Analysis Exponential

a. Use Excel's Data Analysis Exponential Smoothing tool to forecast each of the stock prices using simple exponential smoothing with a smoothing constant of 0.3. Complete the exponential smoothing forecast model for stock A. (Type integers or decimals rounded to two decimal places as needed.) Date Forecast A 09/03/2010 09/07/2010 09/08/2010 126.83 09/09/2010 126.62 09/10/2010 126.85 09/13/2010 127.18 09/14/2010 127.52 09/15/2010 127.68 09/16/2010 128.22 09/17/2010 128.98 09/20/2010 129.66 09/21/2010 130.42 Complete the exponential smoothing forecast model for stock B. (Type integers or decimals rounded to two decimal places as needed.) Date Forecast B 09/03/2010 09/07/2010 18.47 09/08/2010 18.32 09/09/2010 18.22 09/10/2010 18.15 09/13/2010 18.14 09/14/2010 18.29 09/15/2010 18.40 09/16/2010 18.50 09/17/2010 18.66 09/20/2010 18.68 09/21/2010 18.7 b. Compute the MAD and MSE for each of the models. Compute the MAD (mean absolute deviation) for each of the models. (Type integers or decimals rounded to two decimal places as needed.) Stock A O Stock B Compute the MSE (mean square error) for each of the models. (Type integers or decimals rounded to two decimal places as needed.) Stock A Stock BO c. Does a smoothing constant of 0.1 or 0.5 yield better results? Select the correct answer below and, if necessary, fill in the answer box to complete the choice. OA. A smoothing constant of yields better results because the values of MAD and MSE are all higher. (Type an integer or a decimal.) OB. Neither 0.1 nor 0.5 yield better results because the values of MAD and MSE for x = 0.3 are all higher. C. Neither 0.1 nor 0.5 yield better results because the values of MAD and MSE for a=0.3 are all lower. D. A smoothing constant of .5m yields better results because the values of MAD and MSE are all lower. (Type an integer or a decimal.) Date A B D 15.28 15.74 16.12 09/03/2010 126.83 18.47 20.94 09/07/2010 126.83 17.97 20.74 15.54 09/08/2010 126.13 17.98 20.68 09/09/2010 127.37 17.98 20.47 15.77 09/10/2010 127.97 18.13 20.74 16.11 09/13/2010 128.32 18.65 21.14 09/14/2010 128.06 18.66 21.39 09/15/2010 129.46 18.74 21.42 09/16/2010 130.76 19.03 22.11 09/17/2010 131.23 18.71 21.79 09/20/2010 132.21 18.77 21.71 09/21/2010 132.39 19.12 21.78 16.56 16.25 16.45 16.38 16.21 16.67 Stock Exchange 10,363.72 10,435.13 10,399.65 10,438.04 10,449.99 10,533.02 10,471.02 10,494.15 10,613.72 10,639.06 10,719.66 10,683.07

Step by Step Solution

There are 3 Steps involved in it

1 Expert Approved Answer
Step: 1 Unlock blur-text-image
Question Has Been Solved by an Expert!

Get step-by-step solutions from verified subject matter experts

Step: 2 Unlock
Step: 3 Unlock

Students Have Also Explored These Related General Management Questions!