

Question: a. Use Jupyter Notebook Plot the sinc function with the following requirements: Plot in the range x =(-5,5). b. Plot discrete samples with a step
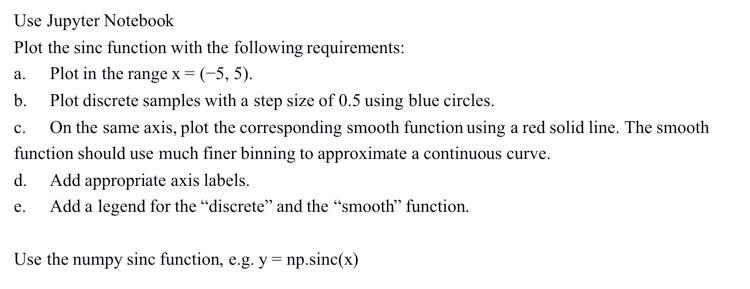
a. Use Jupyter Notebook Plot the sinc function with the following requirements: Plot in the range x =(-5,5). b. Plot discrete samples with a step size of 0.5 using blue circles. On the same axis, plot the corresponding smooth function using a red solid line. The smooth function should use much finer binning to approximate a continuous curve. d. Add appropriate axis labels. Add a legend for the discrete and the "smooth function. c. e. Use the numpy sinc function, e.g. y = np.sinc(x)
Step by Step Solution
There are 3 Steps involved in it
1 Expert Approved Answer
Step: 1 Unlock

Question Has Been Solved by an Expert!
Get step-by-step solutions from verified subject matter experts
Step: 2 Unlock
Step: 3 Unlock