

Question: Use jupyter notebook and please explain code. Data is included. thanks The input cata x1;x2,y can be loaded from fie: x1_x2_y_circle2.csv Work of this file
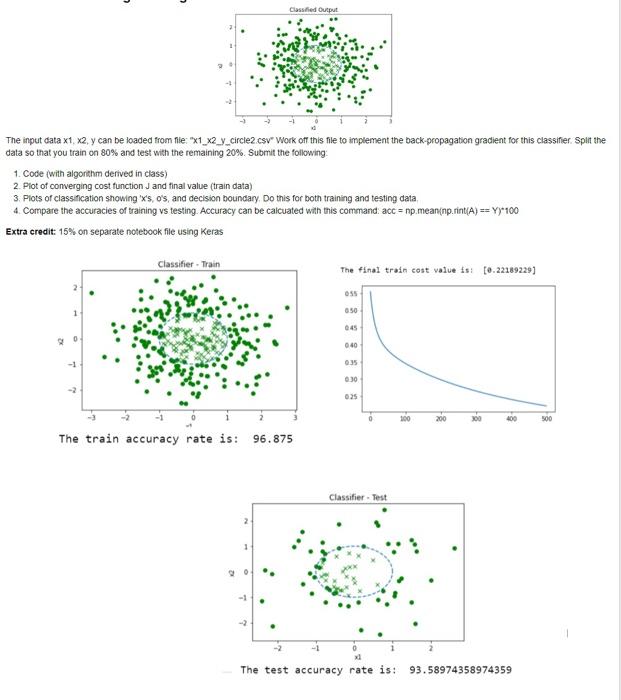
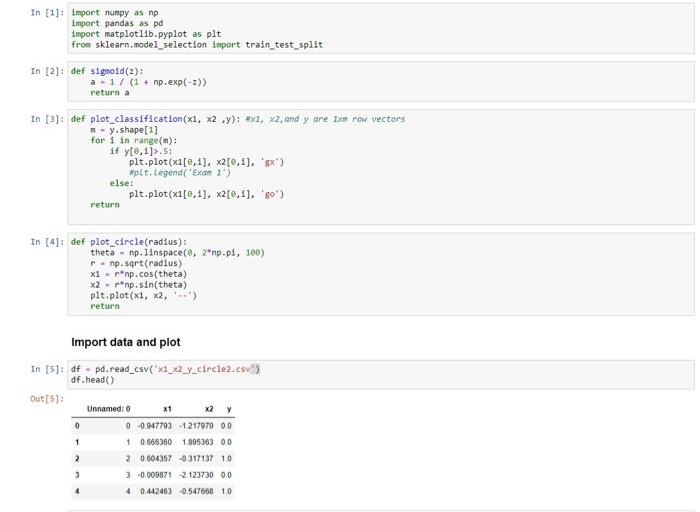
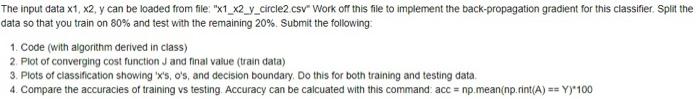
The input cata x1;x2,y can be loaded from fie: "x1_x2_y_circle2.csv" Work of this file to implement the back-propagation gradient for this classifier. Spit the data so that you train on 80% and test with the remaining 20%. Submit the following: 1. Code (with algorthm derived in class) 2. Plot of converging cost function J and final value (train data) 3. Plots of classincation showing ' x 's, o's, and decision boundary. Do this for both training and testing data. 4. Compare the accuracies of training vs testing. Accuracy can be calcuated with this command. acc=np.mean(np.rint (A)==Y)+100 Extra credit: 15% on separate notebook file using Keras In [2]: def 51gnold(z): a=1/(1+np,exp(z)) return a In [3]: def plot_classiflcation (x1,x2,y): \# 1,x2, and y are 1xo row vectors n=y. shape [1] for in in range (m) : if y[,1]>.5 : plt.plot (x1[,1],x2[,1], 'gx') eplt. Legend('Exam 1) else: plt.plot (x1[0,1],x2[0,1], 'go') return Import data and plot In [5]: df = pd.read_csv("x1_x2_y_circle2.csv") df.head() Out[ [5] The input data x1,x2,y can be loaded from file: " x1_x2_y_circle2_.csv" Work off this file to implement the back-propagation gradient for this classifier. Splt the data so that you train on 80% and test with the remaining 20%. Submit the following: 1. Code (with algorithm derived in class) 2. Plot of converging cost function J and final value (train data) 3. Plots of classification showing ' x 's, o's, and decision boundary. Do this for both training and testing data. 4. Compare the accuracies of training vs testing. Accuracy can be calcuated with this command: acc =np.mean(np.rint (A)==Y)100
Step by Step Solution
There are 3 Steps involved in it

Get step-by-step solutions from verified subject matter experts