

Question: a. Use the price data from the table in the popup window, B, for the Standard & Poor's 500 Index, Walmart, and Target to calculate
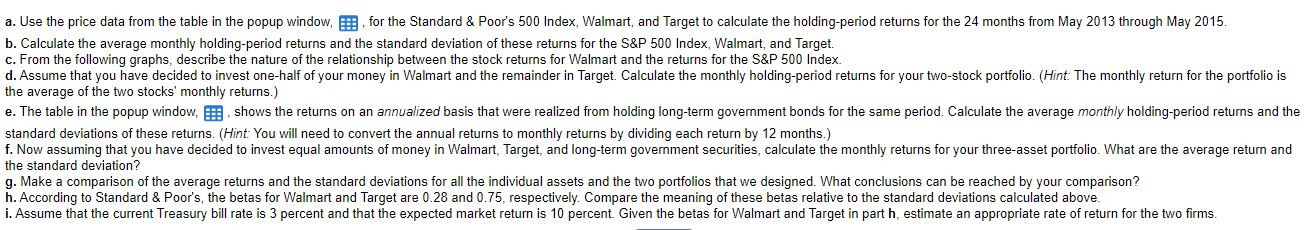
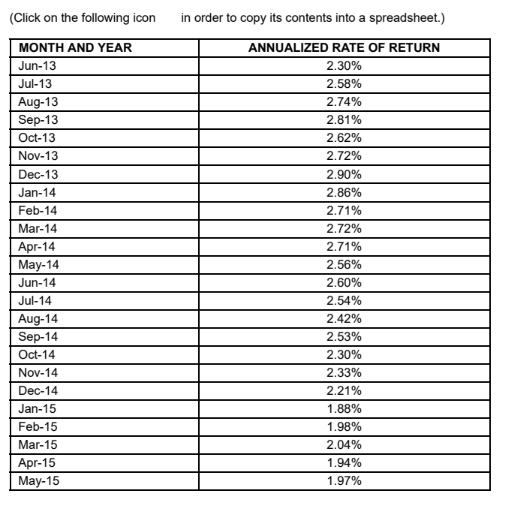
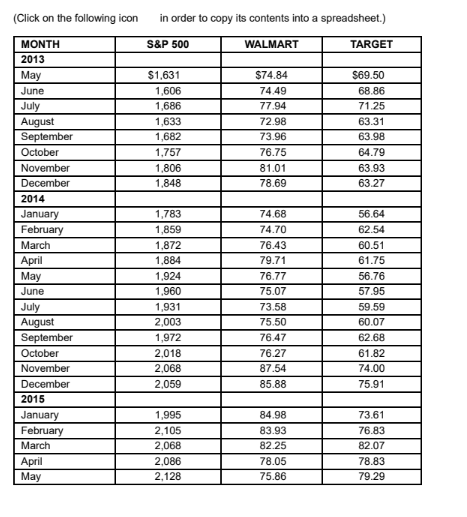

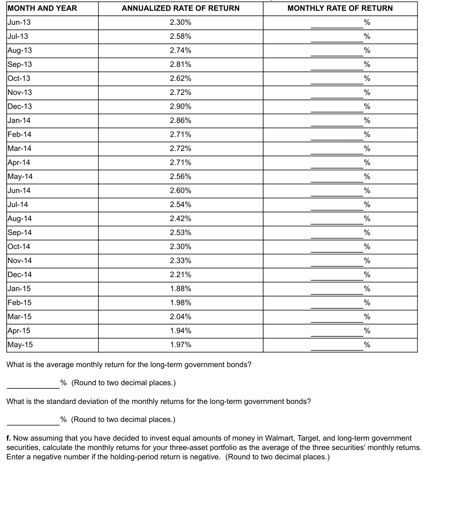
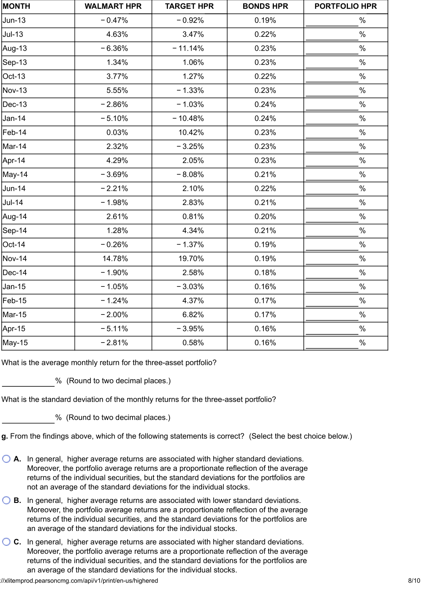
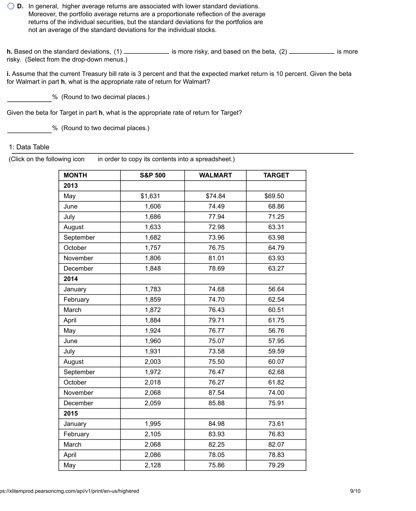
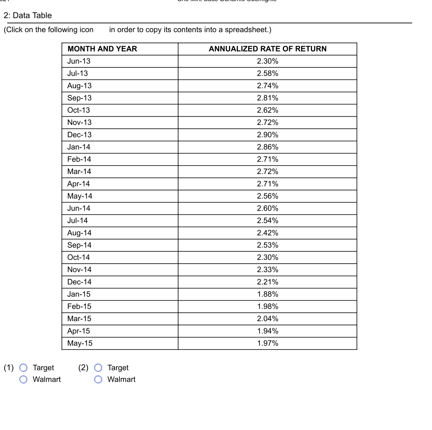
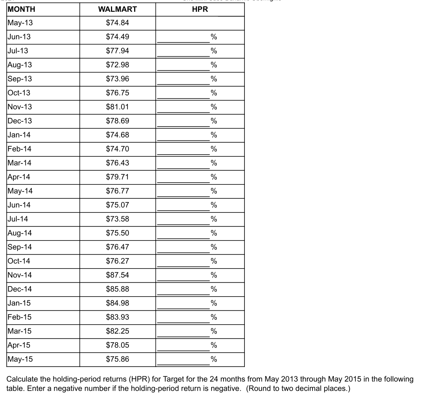
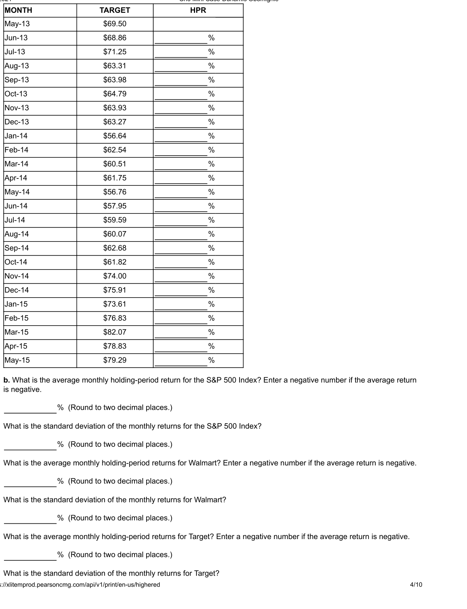
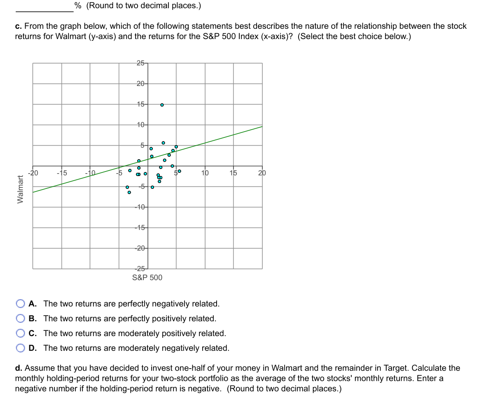
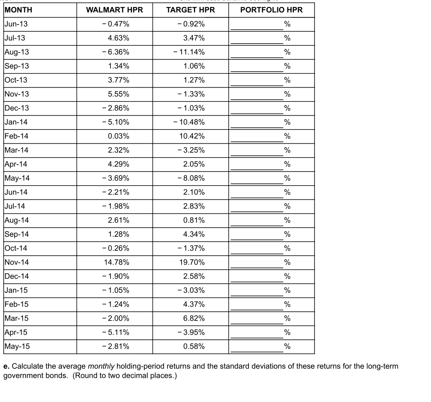
a. Use the price data from the table in the popup window, B, for the Standard & Poor's 500 Index, Walmart, and Target to calculate the holding-period returns for the 24 months from May 2013 through May 2015. b. Calculate the average monthly holding-period returns and the standard deviation of these returns for the S&P 500 Index, Walmart, and Target. c. From the following graphs, describe the nature f the relationship between the stock returns for Walmart and the returns for the S&P 500 Index. d. Assume that you have decided to invest one-half of your money in Walmart and the remainder in Target. Calculate the monthly holding-period returns for your two-stock portfolio. (Hint: The monthly return for the portfolio is the average of the two stocks' monthly returns.) e. The table in the popup window, shows the returns on an annualized basis that were realized from holding long-term government bonds for the same period. Calculate the average monthly holding-period returns and the standard deviations of these returns. (Hint: You will need to convert the annual returns to monthly returns by dividing each return by 12 months.) f. Now assuming that you have decided to invest equal amounts of money in Walmart, Target, and long-term government securities, calculate the monthly returns for your three-asset portfolio. What are the average return and the standard deviation? g. Make a comparison of the average returns and the standard deviations for all the individual assets and the two portfolios that we designed. What conclusions can be reached by your comparison? h. According to Standard & Poor's, the betas for Walmart and Target are 0.28 and 0.75, respectively. Compare the meaning of these betas relative to the standard deviations calculated above. i. Assume that the current Treasury bill rate is 3 percent and that the expected market return is 10 percent. Given the betas for Walmart and Target in part h, estimate an appropriate rate of return for the two firms. in order to copy its contents into a spreadsheet.) (Click on the following icon MONTH AND YEAR Jun-13 Jul-13 Aug-13 Sep-13 Oct-13 Nov-13 Dec-13 Jan-14 Feb-14 Mar-14 Apr-14 May-14 Jun-14 Jul-14 Aug-14 Sep-14 Oct-14 Nov-14 Dec-14 Jan-15 Feb-15 Mar-15 Apr-15 May-15 ANNUALIZED RATE OF RETURN 2.30% 2.58% 2.74% 2.81% 2.62% 2.72% 2.90% 2.86% 2.71% 2.72% 2.71% 2.56% 2.60% 2.54% 2.42% 2.53% 2.30% 2.33% 2.21% 1.88% 1.98% 2.04% 1.94% 1.97% (Click on the following icon in order to copy its contents into a spreadsheet.) S&P 500 WALMART TARGET $1.631 1,606 1,686 1,633 1,682 1.757 1.806 1,848 $74.84 74.49 77.94 72.98 73.96 76.75 81.01 78.69 $69.50 68.86 71.25 63.31 63.98 64.79 63.93 63.27 MONTH 2013 May June July August September October November December 2014 January February March April May June July August September October November December 2015 January February March April May 1,783 1,859 1,872 1.884 1.924 1,960 1,931 2,003 1,972 2.018 2,068 2,059 74.68 74.70 76.43 79.71 76.77 75.07 73.58 75.50 76.47 76.27 87.54 85.88 56.64 62.54 60.51 61.75 56.76 57.95 59.59 60.07 62.68 61.82 74.00 75.91 1,995 2,105 2,068 2,086 2.128 84.98 83.93 82.25 78.05 75.86 73.61 76.83 82.07 78.83 79.29 HPR |MONTH May-13 S&P 500 $1,631 Jun-13 % Jul-13 % % Aug-13 Sep-13 Oct-13 % % Nov-13 % Dec-13 % Jan-14 % Feb-14 % Mar-14 % % Apr-14 May-14 Jun-14 % $1,606 $1,686 $1,633 $1,682 $1,757 $1,806 $1,848 $1,783 $1,859 $1,872 $1,884 $1,924 $1,960 $1,931 $2,003 $1,972 $2,018 $2,068 $2,059 $1,995 $2,105 $2,068 $2,086 $2,128 % Jul-14 % % Aug-14 Sep-14 Oct-14 % % Nov-14 % Dec-14 % Jan-15 % Feb-15 % Mar-15 % % Apr-15 May-15 % Calculate the holding-period returns (HPR) for Walmart for the 24 months from May 2013 through May 2015 in the following table. Enter a negative number if the holding-period return is negative. (Round to two decimal places.) MONTHLY RATE OF RETURN ANNUALIZED RATE OF RETURN 2.30% 2.58% % MONTH AND YEAR Jun-13 Jul 13 Aug-13 Sep-13 Oct-13 Nov.13 % % 2.74% 2.81% % 2.62% 2.72% % Dec 13 Jan-14 2.90% 2.86% % Feb-14 $ % 2.71% 2.72% 2.71% 2.56% 2.60% 2.54% 2.42% $ % 2.53% % Mar 14 Apr 14 May-14 Jun 14 Jul 14 Aug-14 Sep-14 |Oct-14 Nov. 14 Dec-14 Jan-15 Feb-15 Mar 15 Apr-15 May 15 % % 2.30% 2.33% 2.21% 1.88% 1.98% 2.04% 1.94% 1.97% % % $ What is the average monthly return for the long-term government bonds? % (Round to two decimal places.) What is the standard deviation of the monthly returns for the long-term government bonds? % (Round to two decimal places.) f. Now assuming that you have decided to invest equal amounts of money in Walmart, Target, and long-term government Securities, calculate the monthly returns for your three-asset portfolio as the average of the three securities' monthly returns Enter a negative number if the holding period return is negative. (Round to two decimal places.) PORTFOLIO HPR TARGET HPR -0.92% 3.47% % % MONTH Jun-13 Jul-13 Aug-13 Sep-13 Oct-13 Nov.13 Dec-13 % % % % Jan 14 % % Feb-14 % WALMART HPR -0.47% 4.63% -6.38% 1.34% 3.77% 5.55% -2.88% -5.10% 0.03% 2.32% 4.29% -3.69% -2.21% - 1.98% 2.61% 1.28% -0.26% 14.78% -1.90% - 1.05% - 1.24% -2.00% -5.11% -2.81% - 11.14% 1.06% 1.27% -1.33% -1.03% -10.48% 10.42% -3.25% 2.05% -8.08% 2.10% 2.83% 0.81% 4.34% -1.37% 19.70% 2.58% -3.03% 4.37% 6.82% -3.95% 0.58% Mar 14 Apr 14 May-14 Jun-14 Jul-14 Aug-14 Sep-14 Oct-14 Nov.14 Dec-14 Jan-15 Feb-15 Mar-15 Apr-15 May.15 BONDS HPR 0.19% 0.22% 0.23% 0.23% 0.22% 0.23% 0.24% 0.24% 0.23% 0.23% 0.23% 0.21% 0.22% 0.21% 0.20% 0.21% 0.19% 0.19% 0.18% 0.16% 0.17% 0.17% 0.16% 0.16% % % % % % % % % What is the average monthly return for the three-asset portfolio? (Round to two decimal places) What is the standard deviation of the monthly returns for the three-asset portfolio? % (Round to two decimal places.) g. From the findings above, which of the following statements is correct? (Select the best choice below.) O A. In general, higher average returns are associated with higher standard deviations Moreover, the portfolio average returns are a proportionate reflection of the average returns of the individual securities, but the standard deviations for the portfolios are not an average of the standard deviations for the individual stocks OB. In general, higher average returns are associated with lower standard deviations. Moreover, the portfolio average retums are a proportionate reflection of the average returns of the individual securities, and the standard deviations for the portfolios are an average of the standard deviations for the individual stocks. OC. In general, higher average returns are associated with higher standard deviations Moreover, the portfolio average returns are a proportionate reflection of the average returns of the individual securities, and the standard deviations for the portfolios are an average of the standard deviations for the individual stocks. itemprod pearsonomg.com/api/printienus highered 8/10 OD, in general, higher average retums are associated with lower standard deviations Moreover, the portfolio average returns are a proportionate reflection of the average retus of the individual securities, but the standard deviations for the portfolios are not an average of the standard deviations for the individual stocks I. Based on the standard deviations, (1) - is more risky, and based on the beta (2) is more risky. (Select from the drop-down menus.) 1. Assume that the current Treasury bit rate is 3 percent and that the expected market ratum is 10 percent. Given te beta for Walmart in parth, what is the appropriate rate of return for Walmart? $(Round to two decimal places) Given the beta for Target in parth, what is the appropriate rate of retum for Target? $(Round to two decimal places) TARGET $8.50 68.86 71.25 63.31 63.98 64.79 63.90 53.27 1: Data Table (Click on the following icon in order to copy its contents into a spreadsheet) MONTH S&P 500 WALMART 2013 May $1,631 $74.84 June 1.606 74.49 July 1,686 77.94 August 1833 September 1.682 73.96 October 1,757 78.75 November 1805 81.01 December 1.843 78.69 2014 January 1.783 74.60 February 1.859 74.70 78.43 April 18 79.71 1,924 76.77 June 1960 75.07 July 1.931 73.58 August 2.003 75.50 September 1,972 76.47 October 2.018 76.27 November 2.068 87.54 December 2060 85.66 2015 January 1,905 84.58 February 2,105 March 2,068 82.25 April 2.086 78.05 May 2.126 75.00 March 1,872 May 56.64 62.54 60.51 61.75 56.76 57.36 59.59 60.07 62.68 74.00 75.91 73.61 78.83 82.07 78.83 79.29 lidemprod personeng.com/apivirinthighead 910 2: Data Table (Click on the following con in order to copy its contents into a spreadsheet.) MONTH AND YEAR ANNUALIZED RATE OF RETURN Jun-13 2.30% Jul-13 2.58% Aug-13 2.74% Sep-13 2,81% Oct-13 2.62% Nov.13 2.72% Dec-13 2.90% Jan-14 2.86% Feb-14 2.71% Mar-14 2.72% Apr-14 2.71% May-14 2.56% Jun-14 2.60% Jul 14 2.54% Aug-14 2.42% Sep-14 2.53% Oct-14 2.30% Nov-14 2.33% Dec-14 2.21% Jan-15 1.88% Feb-15 1.98% Mar-15 2,04% Apr-15 1.94% May-15 1.97% (1) Target O Walmart (2) Target O Walmart HPR % % % MONTH May-13 Jun-13 Jul-13 Aug-13 Sep-13 Oct-13 Nov.13 Dec-13 Jan-14 Feb-14 Mar-14 Apr-14 May-14 Jun-14 Jul-14 Aug-14 Sep-14 Oct-14 Nov-14 Dec-14 Jan-15 Feb-15 Mar-15 Apr-15 May-15 WALMART $74.84 $74,49 $77.94 $72.98 $73.90 $76.75 $81,01 $78.69 $74.68 $74.70 $76.43 $79.71 $76.77 $75.07 $73.58 $75.50 $76.47 $76.27 $87.54 $85.88 $84.98 $83.93 $82.25 $78.05 $75.86 % % % Calculate the holding period retums (HPR) for Target for the 24 months from May 2013 through May 2015 in the following table. Enter a negative number is the holding period return is negative. (Round to two decimal places.) HPR % % % % % % % MONTH May-13 Jun-13 Jul-13 Aug-13 Sep-13 Oct-13 Nov-13 Dec-13 Jan-14 Feb-14 Mar-14 Apr-14 May-14 Jun-14 Jul 14 Aug-14 Sep-14 Oct-14 % % % % TARGET $69.50 $68.86 $71.25 $63.31 $63.98 $64.79 $63.93 $63.27 $56.64 $62 54 $60.51 $61.75 $56.76 $57.95 $59.59 $60.07 $62.68 $61.82 $74.00 $75.91 $73.61 $76.83 $82 07 $78.83 $79.29 % % % % % % Nov-14 % % % % Dec-14 Jan-15 Feb-15 Mar-15 Apr-15 May-15 % % % b. What is the average monthly holding-period return for the S&P 500 Index? Enter a negative number if the average return is negative. % (Round to two decimal places.) What is the standard deviation of the monthly retums for the S&P 500 Index? % (Round to two decimal places.) What is the average monthly holding-period returns for Walmart? Enter a negative number if the average retum is negative. _% (Round to two decimal places.) What is the standard deviation of the monthly retums for Walmart? % (Round to two decimal places.) What is the average monthly holding-period returns for Target? Enter a negative number if the average return is negative. % (Round to two decimal places.) What is the standard deviation of the monthly returns for Target? ditemprod pearsonomg.com/api/printin-us/highered 4110 % (Round to two decimal places.) c. From the graph below, which of the following statements best describes the nature of the relationship between the stock returns for Walmart (y-axis) and the returns for the S&P 500 Index (x-axis)? (Select the best choice below.) 20 15 . 10 -20 -15 -10 -5 so 1b 15 2b Walmart -10 -15 S&P 500 A. The two returns are perfectly negatively related B. The two returns are perfectly positively related C. The two returns are moderately positively related. D. The two returns are moderately negatively related. d. Assume that you have decided to invest one-half of your money in Walmart and the remainder in Target. Calculate the monthly holding-period returns for your two-stock portfolio as the average of the two stocks' monthly returns. Enter a negative number if the holding-period return is negative. (Round to two decimal places.) PORTFOLIO HPR % % % % % % % MONTH Jun-13 Jul-13 Aug-13 Sep-13 Oct-13 Nov-13 Dec-13 Jan-14 Feb-14 Mar-14 Apr-14 May-14 Jun-14 Jul-14 Aug-14 Sep-14 Oct-14 Nov-14 Dec-14 Jan-15 Feb-15 Mar-15 Apr 15 May-15 WALMART HPR -0.47% 4.63% -6.36% 1.34% 3.77% 5.55% - 2.86% -5.10% 0.03% 2.32% 4.29% -3.69% -2.21% -1.98% 2.61% 1.28% -0.26% 14.78% -1.90% - 1.05% - 1.24% -2.00% -5.11% -2.81% TARGET HPR -0.92% 3.47% - 11.14% 1.06% 1.27% - 1.33% -1.03% - 10.48% 10.42% -3.25% 2.05% -8.08% 2.10% 2.83% 0.81% 4.34% -1.37% 19.70% 2.58% -3.03% 4.37% 6.82% -3.95% 0.58% % % % % % % % % % % e. Calculate the average monthly holding-period returns and the standard deviations of these returns for the long-term government bonds. (Round to two decimal places.) a. Use the price data from the table in the popup window, B, for the Standard & Poor's 500 Index, Walmart, and Target to calculate the holding-period returns for the 24 months from May 2013 through May 2015. b. Calculate the average monthly holding-period returns and the standard deviation of these returns for the S&P 500 Index, Walmart, and Target. c. From the following graphs, describe the nature f the relationship between the stock returns for Walmart and the returns for the S&P 500 Index. d. Assume that you have decided to invest one-half of your money in Walmart and the remainder in Target. Calculate the monthly holding-period returns for your two-stock portfolio. (Hint: The monthly return for the portfolio is the average of the two stocks' monthly returns.) e. The table in the popup window, shows the returns on an annualized basis that were realized from holding long-term government bonds for the same period. Calculate the average monthly holding-period returns and the standard deviations of these returns. (Hint: You will need to convert the annual returns to monthly returns by dividing each return by 12 months.) f. Now assuming that you have decided to invest equal amounts of money in Walmart, Target, and long-term government securities, calculate the monthly returns for your three-asset portfolio. What are the average return and the standard deviation? g. Make a comparison of the average returns and the standard deviations for all the individual assets and the two portfolios that we designed. What conclusions can be reached by your comparison? h. According to Standard & Poor's, the betas for Walmart and Target are 0.28 and 0.75, respectively. Compare the meaning of these betas relative to the standard deviations calculated above. i. Assume that the current Treasury bill rate is 3 percent and that the expected market return is 10 percent. Given the betas for Walmart and Target in part h, estimate an appropriate rate of return for the two firms. in order to copy its contents into a spreadsheet.) (Click on the following icon MONTH AND YEAR Jun-13 Jul-13 Aug-13 Sep-13 Oct-13 Nov-13 Dec-13 Jan-14 Feb-14 Mar-14 Apr-14 May-14 Jun-14 Jul-14 Aug-14 Sep-14 Oct-14 Nov-14 Dec-14 Jan-15 Feb-15 Mar-15 Apr-15 May-15 ANNUALIZED RATE OF RETURN 2.30% 2.58% 2.74% 2.81% 2.62% 2.72% 2.90% 2.86% 2.71% 2.72% 2.71% 2.56% 2.60% 2.54% 2.42% 2.53% 2.30% 2.33% 2.21% 1.88% 1.98% 2.04% 1.94% 1.97% (Click on the following icon in order to copy its contents into a spreadsheet.) S&P 500 WALMART TARGET $1.631 1,606 1,686 1,633 1,682 1.757 1.806 1,848 $74.84 74.49 77.94 72.98 73.96 76.75 81.01 78.69 $69.50 68.86 71.25 63.31 63.98 64.79 63.93 63.27 MONTH 2013 May June July August September October November December 2014 January February March April May June July August September October November December 2015 January February March April May 1,783 1,859 1,872 1.884 1.924 1,960 1,931 2,003 1,972 2.018 2,068 2,059 74.68 74.70 76.43 79.71 76.77 75.07 73.58 75.50 76.47 76.27 87.54 85.88 56.64 62.54 60.51 61.75 56.76 57.95 59.59 60.07 62.68 61.82 74.00 75.91 1,995 2,105 2,068 2,086 2.128 84.98 83.93 82.25 78.05 75.86 73.61 76.83 82.07 78.83 79.29 HPR |MONTH May-13 S&P 500 $1,631 Jun-13 % Jul-13 % % Aug-13 Sep-13 Oct-13 % % Nov-13 % Dec-13 % Jan-14 % Feb-14 % Mar-14 % % Apr-14 May-14 Jun-14 % $1,606 $1,686 $1,633 $1,682 $1,757 $1,806 $1,848 $1,783 $1,859 $1,872 $1,884 $1,924 $1,960 $1,931 $2,003 $1,972 $2,018 $2,068 $2,059 $1,995 $2,105 $2,068 $2,086 $2,128 % Jul-14 % % Aug-14 Sep-14 Oct-14 % % Nov-14 % Dec-14 % Jan-15 % Feb-15 % Mar-15 % % Apr-15 May-15 % Calculate the holding-period returns (HPR) for Walmart for the 24 months from May 2013 through May 2015 in the following table. Enter a negative number if the holding-period return is negative. (Round to two decimal places.) MONTHLY RATE OF RETURN ANNUALIZED RATE OF RETURN 2.30% 2.58% % MONTH AND YEAR Jun-13 Jul 13 Aug-13 Sep-13 Oct-13 Nov.13 % % 2.74% 2.81% % 2.62% 2.72% % Dec 13 Jan-14 2.90% 2.86% % Feb-14 $ % 2.71% 2.72% 2.71% 2.56% 2.60% 2.54% 2.42% $ % 2.53% % Mar 14 Apr 14 May-14 Jun 14 Jul 14 Aug-14 Sep-14 |Oct-14 Nov. 14 Dec-14 Jan-15 Feb-15 Mar 15 Apr-15 May 15 % % 2.30% 2.33% 2.21% 1.88% 1.98% 2.04% 1.94% 1.97% % % $ What is the average monthly return for the long-term government bonds? % (Round to two decimal places.) What is the standard deviation of the monthly returns for the long-term government bonds? % (Round to two decimal places.) f. Now assuming that you have decided to invest equal amounts of money in Walmart, Target, and long-term government Securities, calculate the monthly returns for your three-asset portfolio as the average of the three securities' monthly returns Enter a negative number if the holding period return is negative. (Round to two decimal places.) PORTFOLIO HPR TARGET HPR -0.92% 3.47% % % MONTH Jun-13 Jul-13 Aug-13 Sep-13 Oct-13 Nov.13 Dec-13 % % % % Jan 14 % % Feb-14 % WALMART HPR -0.47% 4.63% -6.38% 1.34% 3.77% 5.55% -2.88% -5.10% 0.03% 2.32% 4.29% -3.69% -2.21% - 1.98% 2.61% 1.28% -0.26% 14.78% -1.90% - 1.05% - 1.24% -2.00% -5.11% -2.81% - 11.14% 1.06% 1.27% -1.33% -1.03% -10.48% 10.42% -3.25% 2.05% -8.08% 2.10% 2.83% 0.81% 4.34% -1.37% 19.70% 2.58% -3.03% 4.37% 6.82% -3.95% 0.58% Mar 14 Apr 14 May-14 Jun-14 Jul-14 Aug-14 Sep-14 Oct-14 Nov.14 Dec-14 Jan-15 Feb-15 Mar-15 Apr-15 May.15 BONDS HPR 0.19% 0.22% 0.23% 0.23% 0.22% 0.23% 0.24% 0.24% 0.23% 0.23% 0.23% 0.21% 0.22% 0.21% 0.20% 0.21% 0.19% 0.19% 0.18% 0.16% 0.17% 0.17% 0.16% 0.16% % % % % % % % % What is the average monthly return for the three-asset portfolio? (Round to two decimal places) What is the standard deviation of the monthly returns for the three-asset portfolio? % (Round to two decimal places.) g. From the findings above, which of the following statements is correct? (Select the best choice below.) O A. In general, higher average returns are associated with higher standard deviations Moreover, the portfolio average returns are a proportionate reflection of the average returns of the individual securities, but the standard deviations for the portfolios are not an average of the standard deviations for the individual stocks OB. In general, higher average returns are associated with lower standard deviations. Moreover, the portfolio average retums are a proportionate reflection of the average returns of the individual securities, and the standard deviations for the portfolios are an average of the standard deviations for the individual stocks. OC. In general, higher average returns are associated with higher standard deviations Moreover, the portfolio average returns are a proportionate reflection of the average returns of the individual securities, and the standard deviations for the portfolios are an average of the standard deviations for the individual stocks. itemprod pearsonomg.com/api/printienus highered 8/10 OD, in general, higher average retums are associated with lower standard deviations Moreover, the portfolio average returns are a proportionate reflection of the average retus of the individual securities, but the standard deviations for the portfolios are not an average of the standard deviations for the individual stocks I. Based on the standard deviations, (1) - is more risky, and based on the beta (2) is more risky. (Select from the drop-down menus.) 1. Assume that the current Treasury bit rate is 3 percent and that the expected market ratum is 10 percent. Given te beta for Walmart in parth, what is the appropriate rate of return for Walmart? $(Round to two decimal places) Given the beta for Target in parth, what is the appropriate rate of retum for Target? $(Round to two decimal places) TARGET $8.50 68.86 71.25 63.31 63.98 64.79 63.90 53.27 1: Data Table (Click on the following icon in order to copy its contents into a spreadsheet) MONTH S&P 500 WALMART 2013 May $1,631 $74.84 June 1.606 74.49 July 1,686 77.94 August 1833 September 1.682 73.96 October 1,757 78.75 November 1805 81.01 December 1.843 78.69 2014 January 1.783 74.60 February 1.859 74.70 78.43 April 18 79.71 1,924 76.77 June 1960 75.07 July 1.931 73.58 August 2.003 75.50 September 1,972 76.47 October 2.018 76.27 November 2.068 87.54 December 2060 85.66 2015 January 1,905 84.58 February 2,105 March 2,068 82.25 April 2.086 78.05 May 2.126 75.00 March 1,872 May 56.64 62.54 60.51 61.75 56.76 57.36 59.59 60.07 62.68 74.00 75.91 73.61 78.83 82.07 78.83 79.29 lidemprod personeng.com/apivirinthighead 910 2: Data Table (Click on the following con in order to copy its contents into a spreadsheet.) MONTH AND YEAR ANNUALIZED RATE OF RETURN Jun-13 2.30% Jul-13 2.58% Aug-13 2.74% Sep-13 2,81% Oct-13 2.62% Nov.13 2.72% Dec-13 2.90% Jan-14 2.86% Feb-14 2.71% Mar-14 2.72% Apr-14 2.71% May-14 2.56% Jun-14 2.60% Jul 14 2.54% Aug-14 2.42% Sep-14 2.53% Oct-14 2.30% Nov-14 2.33% Dec-14 2.21% Jan-15 1.88% Feb-15 1.98% Mar-15 2,04% Apr-15 1.94% May-15 1.97% (1) Target O Walmart (2) Target O Walmart HPR % % % MONTH May-13 Jun-13 Jul-13 Aug-13 Sep-13 Oct-13 Nov.13 Dec-13 Jan-14 Feb-14 Mar-14 Apr-14 May-14 Jun-14 Jul-14 Aug-14 Sep-14 Oct-14 Nov-14 Dec-14 Jan-15 Feb-15 Mar-15 Apr-15 May-15 WALMART $74.84 $74,49 $77.94 $72.98 $73.90 $76.75 $81,01 $78.69 $74.68 $74.70 $76.43 $79.71 $76.77 $75.07 $73.58 $75.50 $76.47 $76.27 $87.54 $85.88 $84.98 $83.93 $82.25 $78.05 $75.86 % % % Calculate the holding period retums (HPR) for Target for the 24 months from May 2013 through May 2015 in the following table. Enter a negative number is the holding period return is negative. (Round to two decimal places.) HPR % % % % % % % MONTH May-13 Jun-13 Jul-13 Aug-13 Sep-13 Oct-13 Nov-13 Dec-13 Jan-14 Feb-14 Mar-14 Apr-14 May-14 Jun-14 Jul 14 Aug-14 Sep-14 Oct-14 % % % % TARGET $69.50 $68.86 $71.25 $63.31 $63.98 $64.79 $63.93 $63.27 $56.64 $62 54 $60.51 $61.75 $56.76 $57.95 $59.59 $60.07 $62.68 $61.82 $74.00 $75.91 $73.61 $76.83 $82 07 $78.83 $79.29 % % % % % % Nov-14 % % % % Dec-14 Jan-15 Feb-15 Mar-15 Apr-15 May-15 % % % b. What is the average monthly holding-period return for the S&P 500 Index? Enter a negative number if the average return is negative. % (Round to two decimal places.) What is the standard deviation of the monthly retums for the S&P 500 Index? % (Round to two decimal places.) What is the average monthly holding-period returns for Walmart? Enter a negative number if the average retum is negative. _% (Round to two decimal places.) What is the standard deviation of the monthly retums for Walmart? % (Round to two decimal places.) What is the average monthly holding-period returns for Target? Enter a negative number if the average return is negative. % (Round to two decimal places.) What is the standard deviation of the monthly returns for Target? ditemprod pearsonomg.com/api/printin-us/highered 4110 % (Round to two decimal places.) c. From the graph below, which of the following statements best describes the nature of the relationship between the stock returns for Walmart (y-axis) and the returns for the S&P 500 Index (x-axis)? (Select the best choice below.) 20 15 . 10 -20 -15 -10 -5 so 1b 15 2b Walmart -10 -15 S&P 500 A. The two returns are perfectly negatively related B. The two returns are perfectly positively related C. The two returns are moderately positively related. D. The two returns are moderately negatively related. d. Assume that you have decided to invest one-half of your money in Walmart and the remainder in Target. Calculate the monthly holding-period returns for your two-stock portfolio as the average of the two stocks' monthly returns. Enter a negative number if the holding-period return is negative. (Round to two decimal places.) PORTFOLIO HPR % % % % % % % MONTH Jun-13 Jul-13 Aug-13 Sep-13 Oct-13 Nov-13 Dec-13 Jan-14 Feb-14 Mar-14 Apr-14 May-14 Jun-14 Jul-14 Aug-14 Sep-14 Oct-14 Nov-14 Dec-14 Jan-15 Feb-15 Mar-15 Apr 15 May-15 WALMART HPR -0.47% 4.63% -6.36% 1.34% 3.77% 5.55% - 2.86% -5.10% 0.03% 2.32% 4.29% -3.69% -2.21% -1.98% 2.61% 1.28% -0.26% 14.78% -1.90% - 1.05% - 1.24% -2.00% -5.11% -2.81% TARGET HPR -0.92% 3.47% - 11.14% 1.06% 1.27% - 1.33% -1.03% - 10.48% 10.42% -3.25% 2.05% -8.08% 2.10% 2.83% 0.81% 4.34% -1.37% 19.70% 2.58% -3.03% 4.37% 6.82% -3.95% 0.58% % % % % % % % % % % e. Calculate the average monthly holding-period returns and the standard deviations of these returns for the long-term government bonds. (Round to two decimal places.)
Step by Step Solution
There are 3 Steps involved in it

Get step-by-step solutions from verified subject matter experts