

Question: A) using the acceleration time graph showing figure 7, create a table calculating the velocity at 1.0s intervals give. that the initial velocity of the
A) using the acceleration time graph showing figure 7, create a table calculating the velocity at 1.0s intervals give. that the initial velocity of the object described is 5.0 m/s (e) b) use what you found in (a)to draw the velocity time graph.
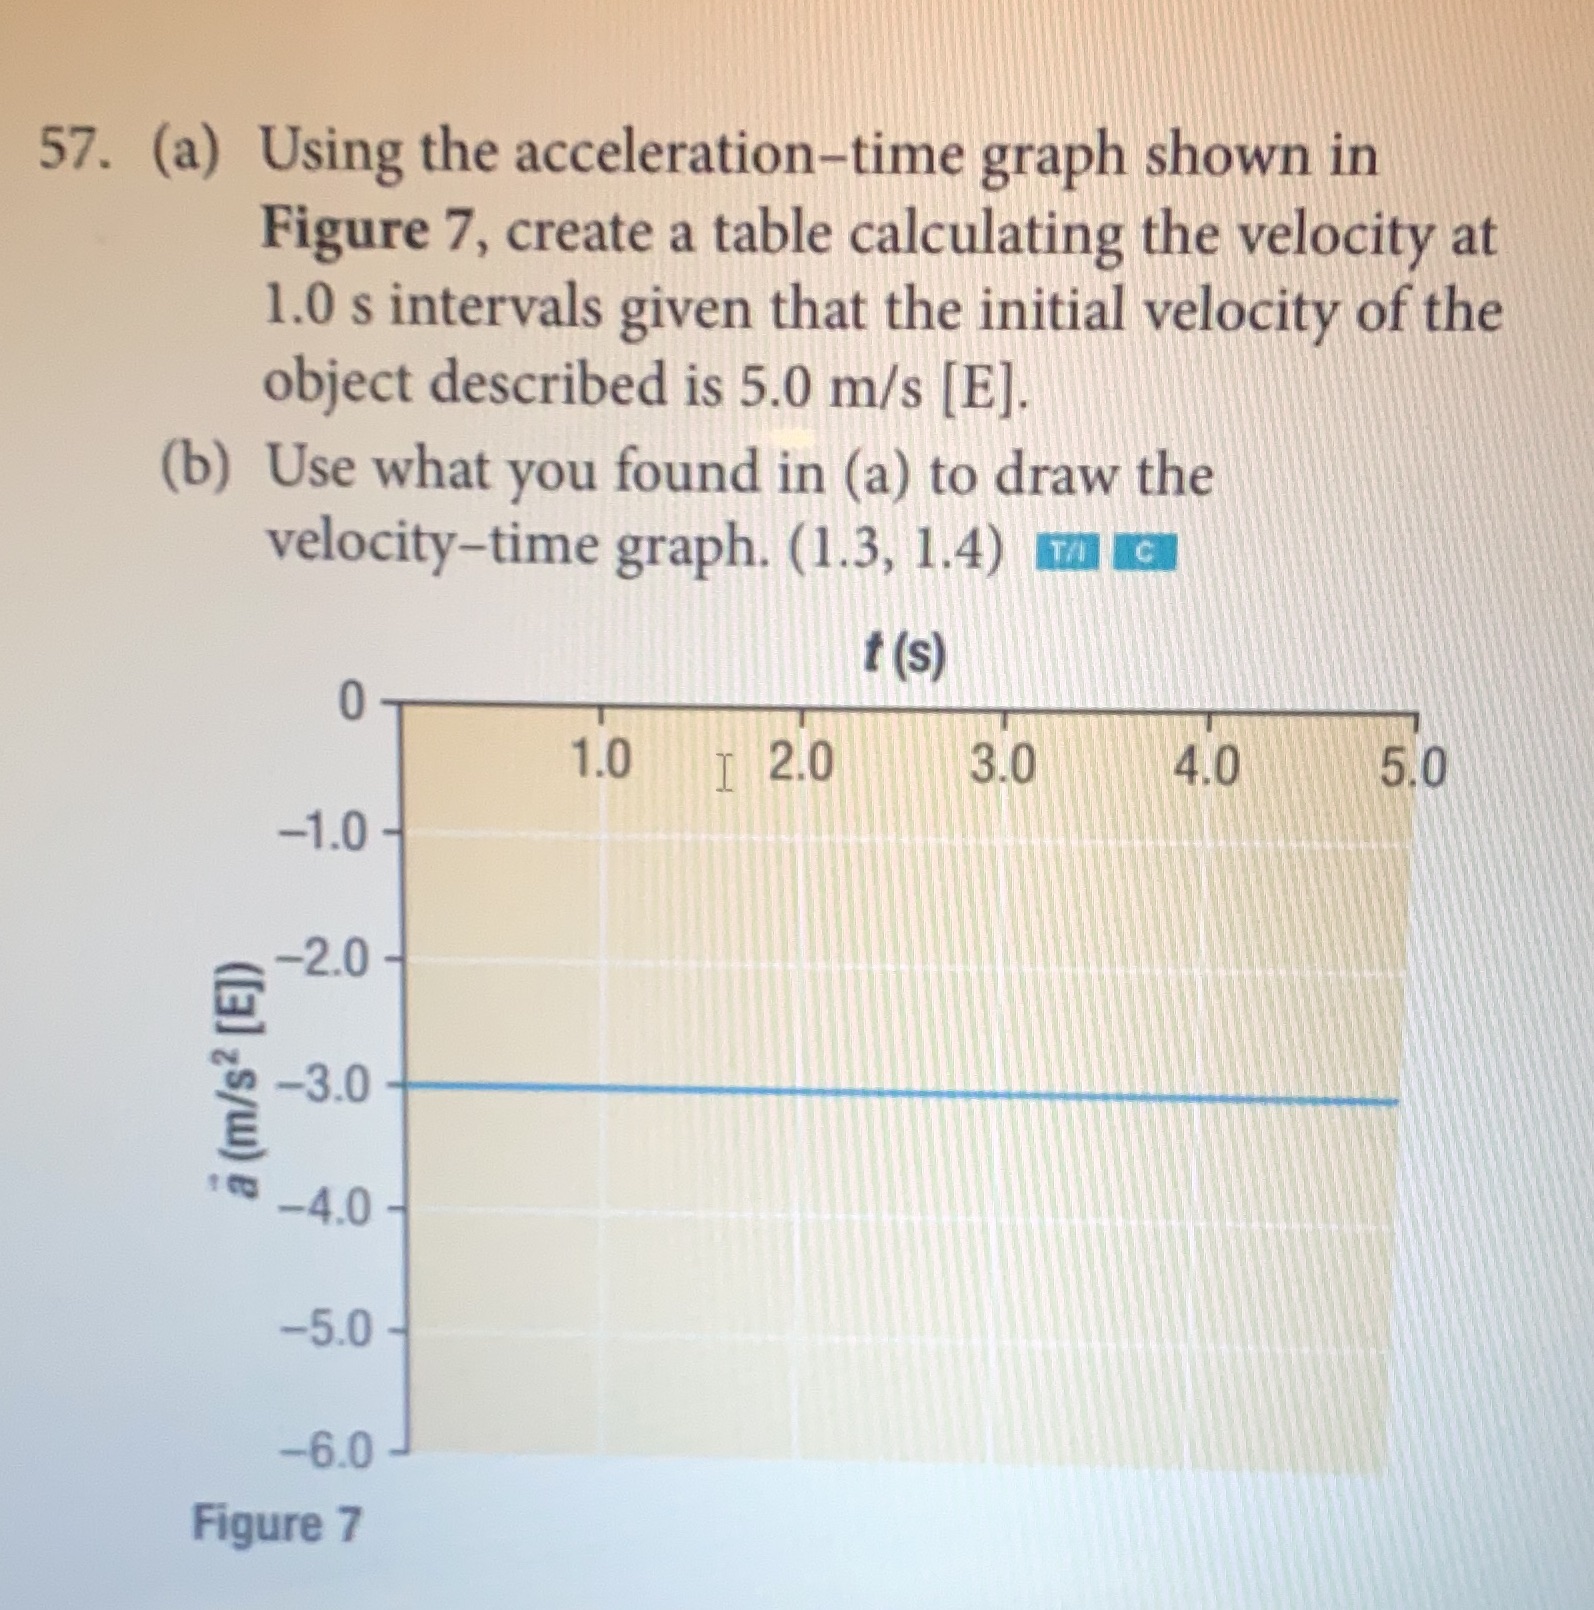
57. (a) Using the acceleration-time graph shown in Figure 7, create a table calculating the velocity at 1.0 s intervals given that the initial velocity of the object described is 5.0 m/s [E]. (b) Use what you found in (a) to draw the velocity-time graph. (1.3, 1.4) Tag t (s) 0 1.0 1 2.0 3.0 4.0 5.0 -1.0 - -2.0 - a (m/s? [E]) -3.0 -4.0 -5.0 -6.0 Figure 7
Step by Step Solution
There are 3 Steps involved in it
1 Expert Approved Answer
Step: 1 Unlock

Question Has Been Solved by an Expert!
Get step-by-step solutions from verified subject matter experts
Step: 2 Unlock
Step: 3 Unlock