

Question: a. Using the data provided, graph both the demand and supply of milk, and identify the equilibrium point, E. b. You have been advised
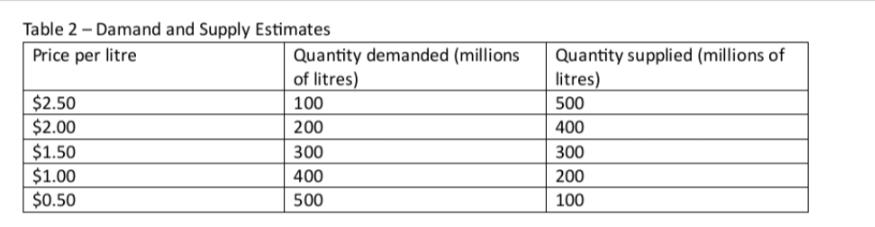
a. Using the data provided, graph both the demand and supply of milk, and identify the equilibrium point, E. b. You have been advised that the government has enacted a milk price support of $2.00 per litre. Indicate this action on your graph and explain the effect on the market for milk. c. Use graphs to illustrate what would happen to the market for milk if the government imposes a price ceiling of $1.00 per litre of milk. d. Explain the motivation that the government would have for setting (a) a price ceiling and (b) a price floor. Price per litre Table 2-Damand and Supply Estimates Quantity demanded (millions Quantity supplied (millions of of litres) litres) $2.50 100 500 $2.00 200 400 $1.50 300 300 $1.00 400 200 $0.50 500 100
Step by Step Solution
There are 3 Steps involved in it

Get step-by-step solutions from verified subject matter experts