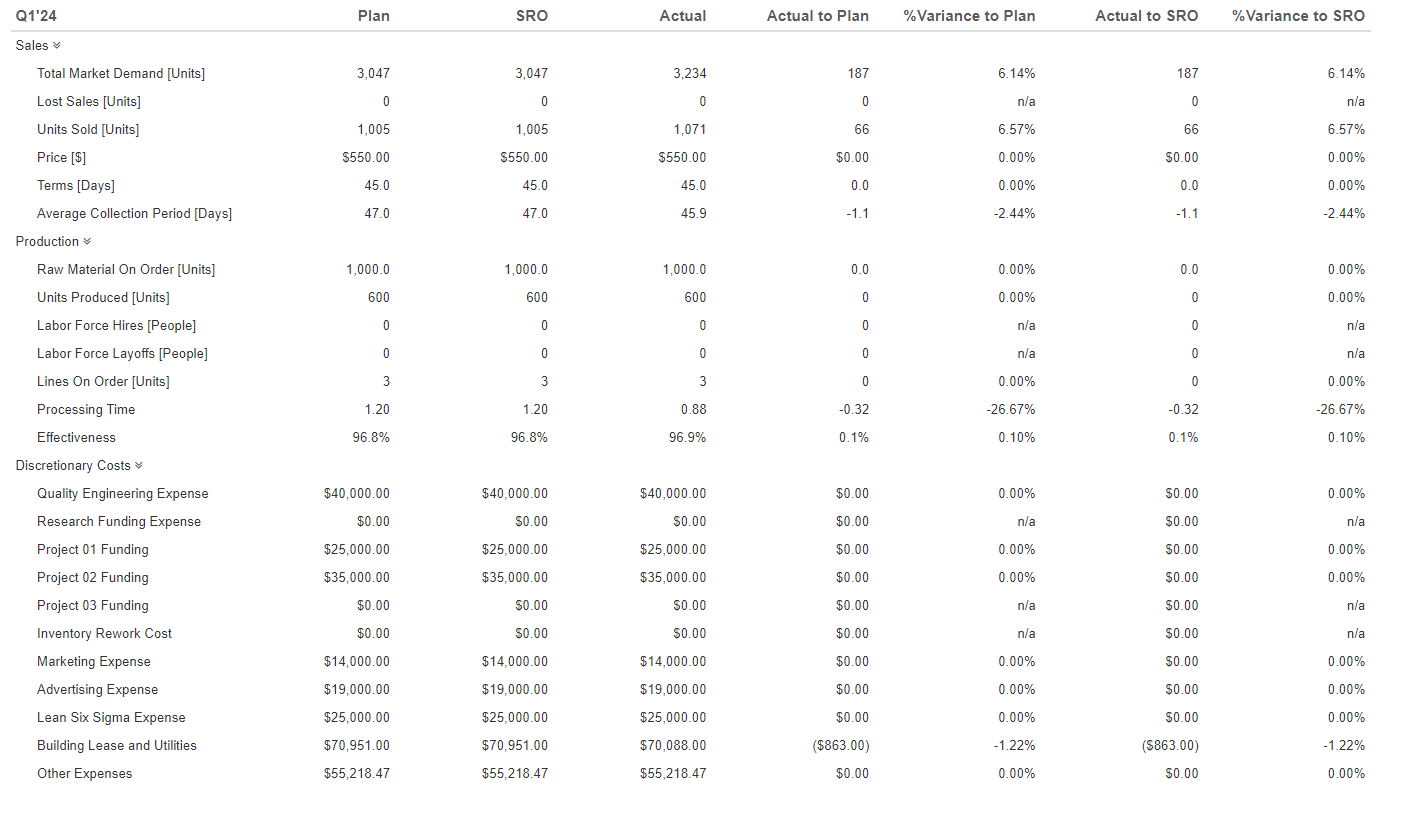
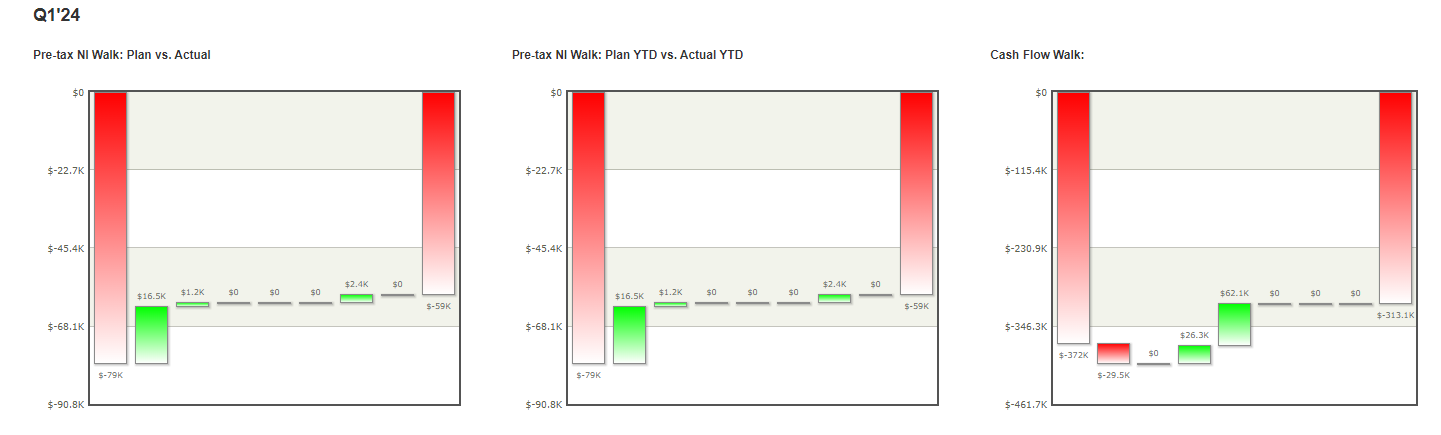
Question: a. Using the Pre-Tax Net Income (Plan vs Actual + SRO) Walk Chart, analyze the Growth and Market Share variances and explain the key drivers.
a. Using the Pre-Tax Net Income (Plan vs Actual + SRO) Walk Chart, analyze the Growth and Market Share variances and explain the key drivers. Provide data to support your analysis.
b. Using the Cash Flow Walk Chart, identify two large sources/uses of cash and explain the key drivers. Provide data to support your explanations.
c. What was the biggest issue in developing your budget and why?
d. What additional information would you like to share about your factory's supply chain performance. Focus on the people, productivity, material, or inspection decisions.
Q1'24 Plan SRO Actual Actual to Plan % Variance to Plan Actual to SRO % Variance to SRO Sales * Total Market Demand [Units] 3,047 3,047 3,234 187 6.14% 187 6.14% Lost Sales [Units] n/a n/a Units Sold [Units] 1,005 1,005 1,071 66 6.57% 66 6.57% Price [$] $550.00 $550.00 $550.00 $0.00 0.00% $0.00 0.00% Terms [Days] 45.0 45.0 45.0 0.0 0.00% 0.0 0.00% Average Collection Period [Days] 47.0 47.0 45.9 -1.1 -2.44% -1.1 -2.44% Production Raw Material On Order [Units] 1,000.0 1,000.0 1,000.0 0.0 0.00% 0.0 0.00% Units Produced [Units] 600 600 600 O 0.00% 0.00% Labor Force Hires [People] 0 0 0 n/a n/a oo Labor Force Layoffs [People] 0 0 O n/a n/a Lines On Order [Units] 3 3 3 0 0.00% O 0.00% Processing Time 1.20 1.20 0.88 -0.32 -26.67% -0.32 -26.67% Effectiveness 96.8% 96.8% 96.9% 0.1% 0. 10% 0.1% 0.10% Discretionary Costs Quality Engineering Expense $40,000.00 $40,000.00 $40,000.00 $0.00 0.00% $0.00 0.00% Research Funding Expense $0.00 $0.00 $0.00 $0.00 n/a $0.00 n/a Project 01 Funding $25,000.00 $25,000.00 $25,000.00 $0.00 0.00% $0.00 0.00% Project 02 Funding $35,000.00 $35,000.00 $35,000.00 $0.00 0.00% $0.00 0.00% Project 03 Funding $0.00 50.00 50.00 $0.00 n/a $0.00 n/a Inventory Rework Cost $0.00 50.00 50.00 $0.00 n/a $0.00 na Marketing Expense $14,000.00 $14,000.00 $14,000.00 $0.00 0.00% $0.00 0.00% Advertising Expense $19,000.00 $19,000.00 $19,000.00 $0.00 0.00% $0.00 0.00% Lean Six Sigma Expense $25,000.00 $25,000.00 $25,000.00 $0.00 0.00% $0.00 0.00% Building Lease and Utilities $70,951.00 $70,951.00 $70,088.00 ($863.00) -1.22% ($863.00) -1.22% Other Expenses $55,218.47 $55,218.47 $55,218.47 $0.00 0.00% $0.00 0.00%Q1'24 Pre-tax NI Walk: Plan vs. Actual Pre-tax NI Walk: Plan YTD vs. Actual YTD Cash Flow Walk: $0 $0 $0 $-22.7K $-22.7K $-115.4K $-45.4K $-45.4K $-230.9K $2.4K $0 $16.5K $1.2K $0 SO $2.4K $O $16.5K $1.2K $0 $0 $0 $-59K $62.1K $0 SO $-68.1K $-59K SO $-68.1K $-346.3K $-313.1k $26.3K $-79K $-372K $0 $-79K $-29.5K $-90.8K $-90.8K $-461.7K
Step by Step Solution
There are 3 Steps involved in it
1 Expert Approved Answer
Step: 1 Unlock
Question Has Been Solved by an Expert!
Get step-by-step solutions from verified subject matter experts
Step: 2 Unlock
Step: 3 Unlock
Students Have Also Explored These Related Finance Questions!