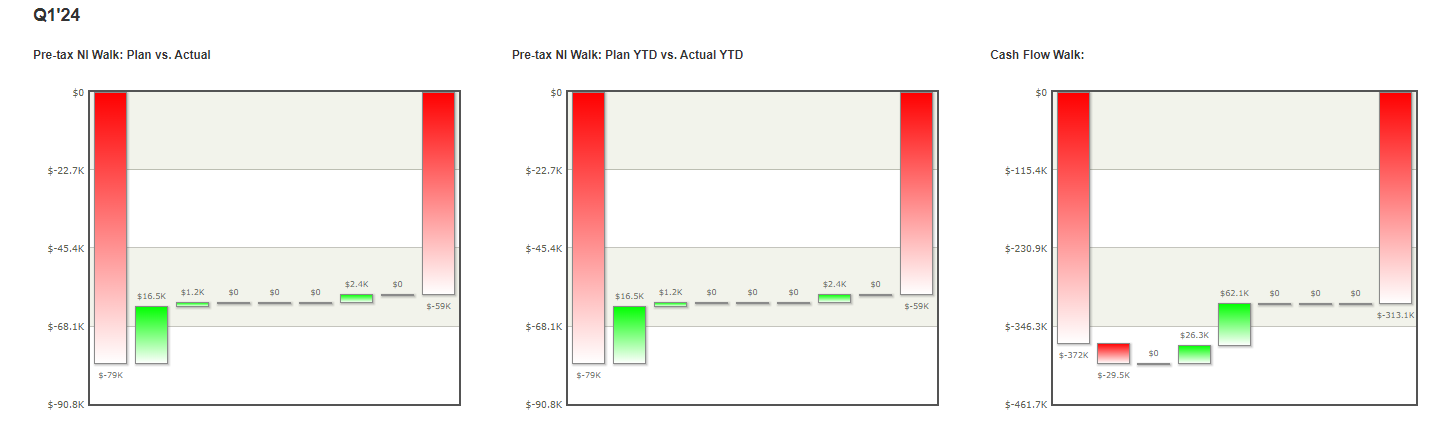
Question: a. Using the Pre-Tax Net Income (Plan vs Actual + SRO) Walk Chart, analyze the Growth and Market Share variances and explain the key drivers.
a. Using the Pre-Tax Net Income (Plan vs Actual + SRO) Walk Chart, analyze the Growth and Market Share variances and explain the key drivers. Provide data to support your analysis.
b. Using the Pre-Tax Net Income (Plan vs Actual + SRO) Walk Chart, analyze the Growth and Market Share variances and explain the key drivers. Provide data to support your analysis.
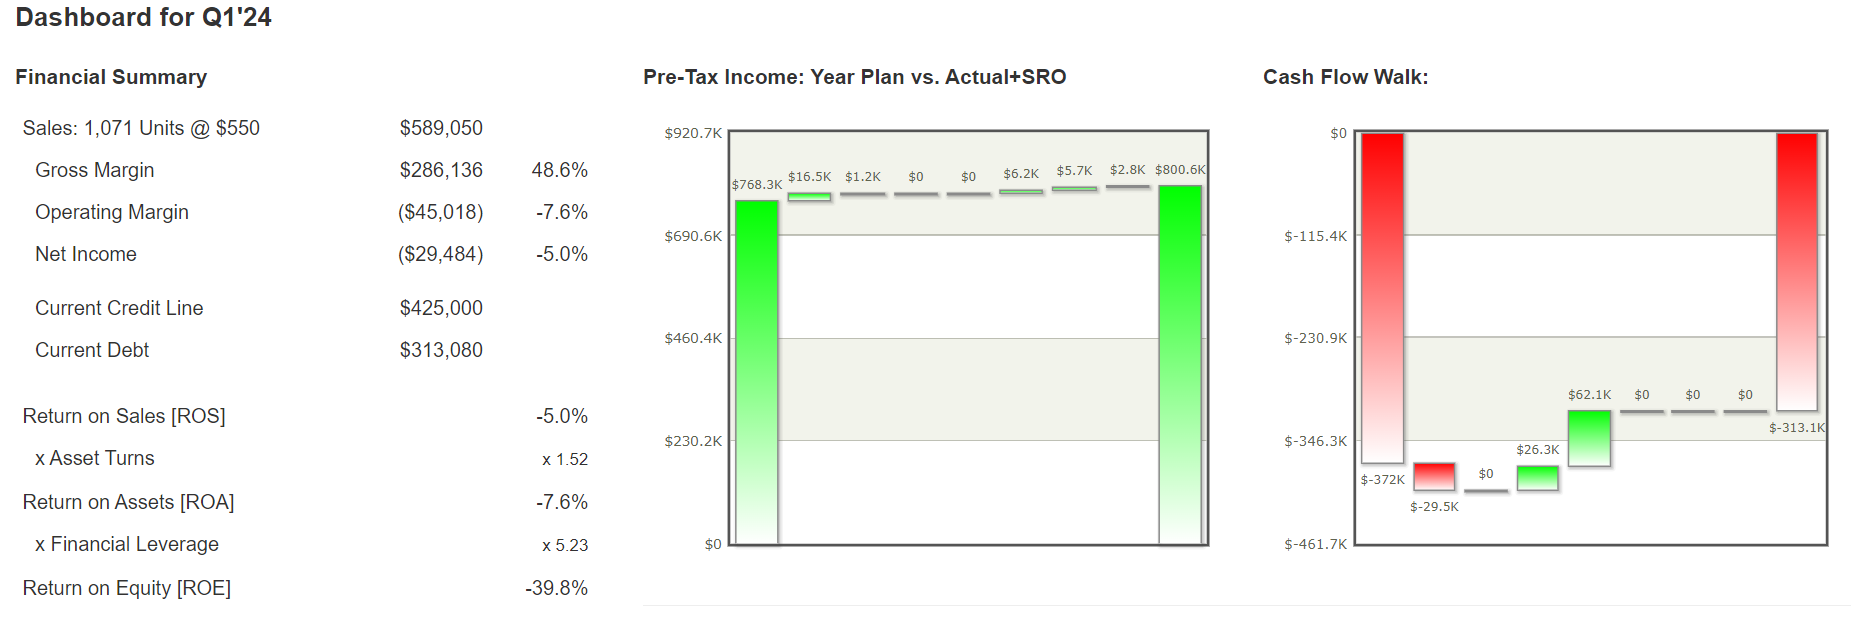
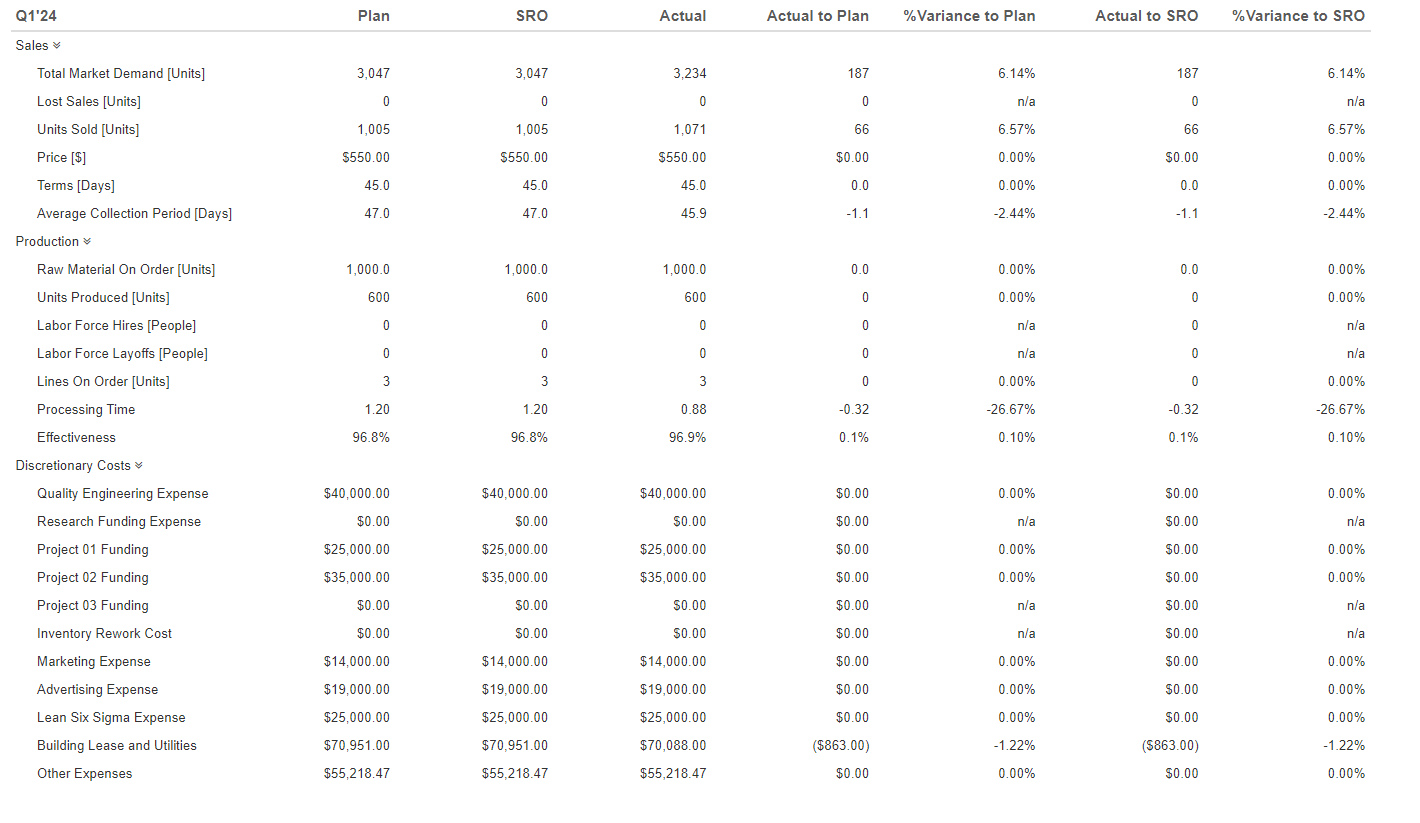
Dashboard for Q1'24 Financial Summary Sales: 1,071 Units @ $550 Gross Margin Operating Margin Net Income Current Credit Line Current Debt Return on Sales [ROS] x Asset Turns Return on Assets [ROA] x Financial Leverage Return on Equity [ROE] $589,050 $286,136 48.6% ($45,018) -7.6% ($29,464) 6.0% $425,000 $313,080 -5.0% x152 -7.6% x 523 69.8% Pre-Tax Income: Year Plan vs. Actual+5R0 5920 7K 5690 SK 5460 4K 5230,2K $0 $765.3K 16.5K $12K $5.2K $5.7K 2.EK $500 5K 2 _ _ _ = =. Cash Flow Walk: $0 $7115.4K $7230.9K $7346.3K $-461.7K $62.1K an $11 $u Q1'24 Plan SRO Actual Actual to Plan % Variance to Plan Actual to SRO % Variance to SRO Sales * Total Market Demand [Units] 3,047 3,047 3,234 187 6.14% 187 6.14% Lost Sales [Units] n/a n/a Units Sold [Units] 1,005 1,005 1,071 66 6.57% 66 6.57% Price [$] $550.00 $550.00 $550.00 $0.00 0.00% $0.00 0.00% Terms [Days] 45.0 45.0 45.0 0.0 0.00% 0.0 0.00% Average Collection Period [Days] 47.0 47.0 45.9 -1.1 -2.44% -1.1 -2.44% Production Raw Material On Order [Units] 1,000.0 1,000.0 1,000.0 0.0 0.00% 0.0 0.00% Units Produced [Units] 600 600 600 O 0.00% 0.00% Labor Force Hires [People] 0 0 0 n/a n/a oo Labor Force Layoffs [People] 0 0 O n/a n/a Lines On Order [Units] 3 3 3 0 0.00% O 0.00% Processing Time 1.20 1.20 0.88 -0.32 -26.67% -0.32 -26.67% Effectiveness 96.8% 96.8% 96.9% 0.1% 0. 10% 0.1% 0.10% Discretionary Costs Quality Engineering Expense $40,000.00 $40,000.00 $40,000.00 $0.00 0.00% $0.00 0.00% Research Funding Expense $0.00 $0.00 $0.00 $0.00 n/a $0.00 n/a Project 01 Funding $25,000.00 $25,000.00 $25,000.00 $0.00 0.00% $0.00 0.00% Project 02 Funding $35,000.00 $35,000.00 $35,000.00 $0.00 0.00% $0.00 0.00% Project 03 Funding $0.00 50.00 50.00 $0.00 n/a $0.00 n/a Inventory Rework Cost $0.00 50.00 50.00 $0.00 n/a $0.00 na Marketing Expense $14,000.00 $14,000.00 $14,000.00 $0.00 0.00% $0.00 0.00% Advertising Expense $19,000.00 $19,000.00 $19,000.00 $0.00 0.00% $0.00 0.00% Lean Six Sigma Expense $25,000.00 $25,000.00 $25,000.00 $0.00 0.00% $0.00 0.00% Building Lease and Utilities $70,951.00 $70,951.00 $70,088.00 ($863.00) -1.22% ($863.00) -1.22% Other Expenses $55,218.47 $55,218.47 $55,218.47 $0.00 0.00% $0.00 0.00%Q1'24 Pre-tax NI Walk: Plan vs. Actual Pre-tax NI Walk: Plan YTD vs. Actual YTD Cash Flow Walk: $0 $0 $0 $-22.7K $-22.7K $-115.4K $-45.4K $-45.4K $-230.9K $2.4K $0 $16.5K $1.2K $0 SO $2.4K $O $16.5K $1.2K $0 $0 $0 $-59K $62.1K $0 SO $-68.1K $-59K SO $-68.1K $-346.3K $-313.1k $26.3K $-79K $-372K $0 $-79K $-29.5K $-90.8K $-90.8K $-461.7K
Step by Step Solution
There are 3 Steps involved in it
1 Expert Approved Answer
Step: 1 Unlock
Question Has Been Solved by an Expert!
Get step-by-step solutions from verified subject matter experts
Step: 2 Unlock
Step: 3 Unlock
Students Have Also Explored These Related Finance Questions!