

Question: a. Using the Pre-Tax Net Income (Plan vs Actual + SRO) Walk Chart, analyze the Growth and Market Share variances and explain the key
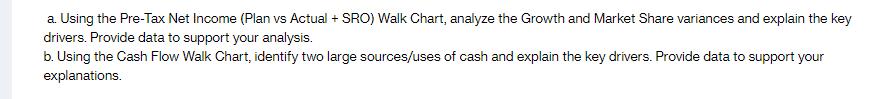
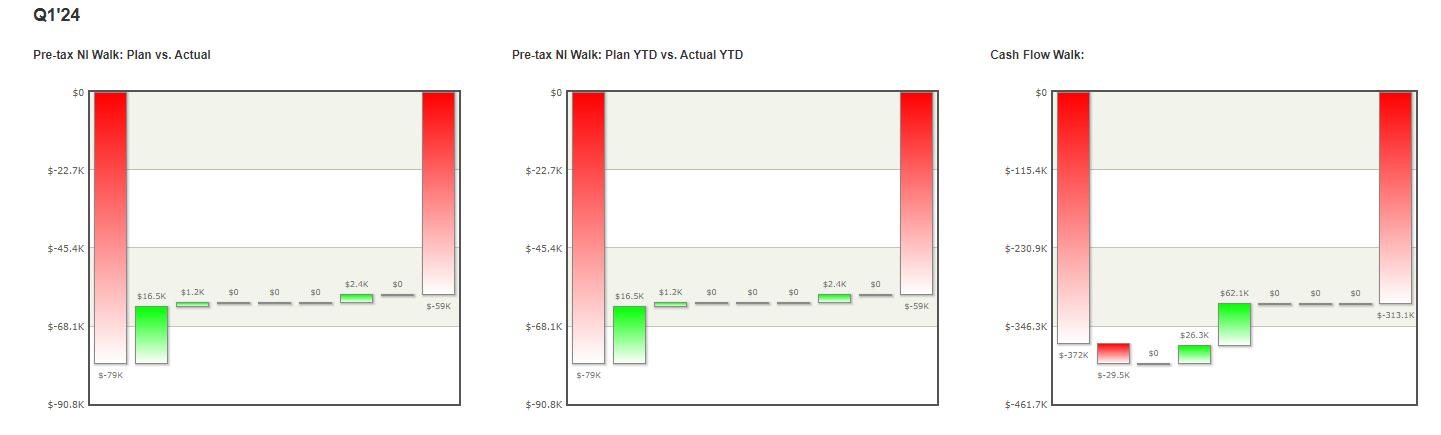
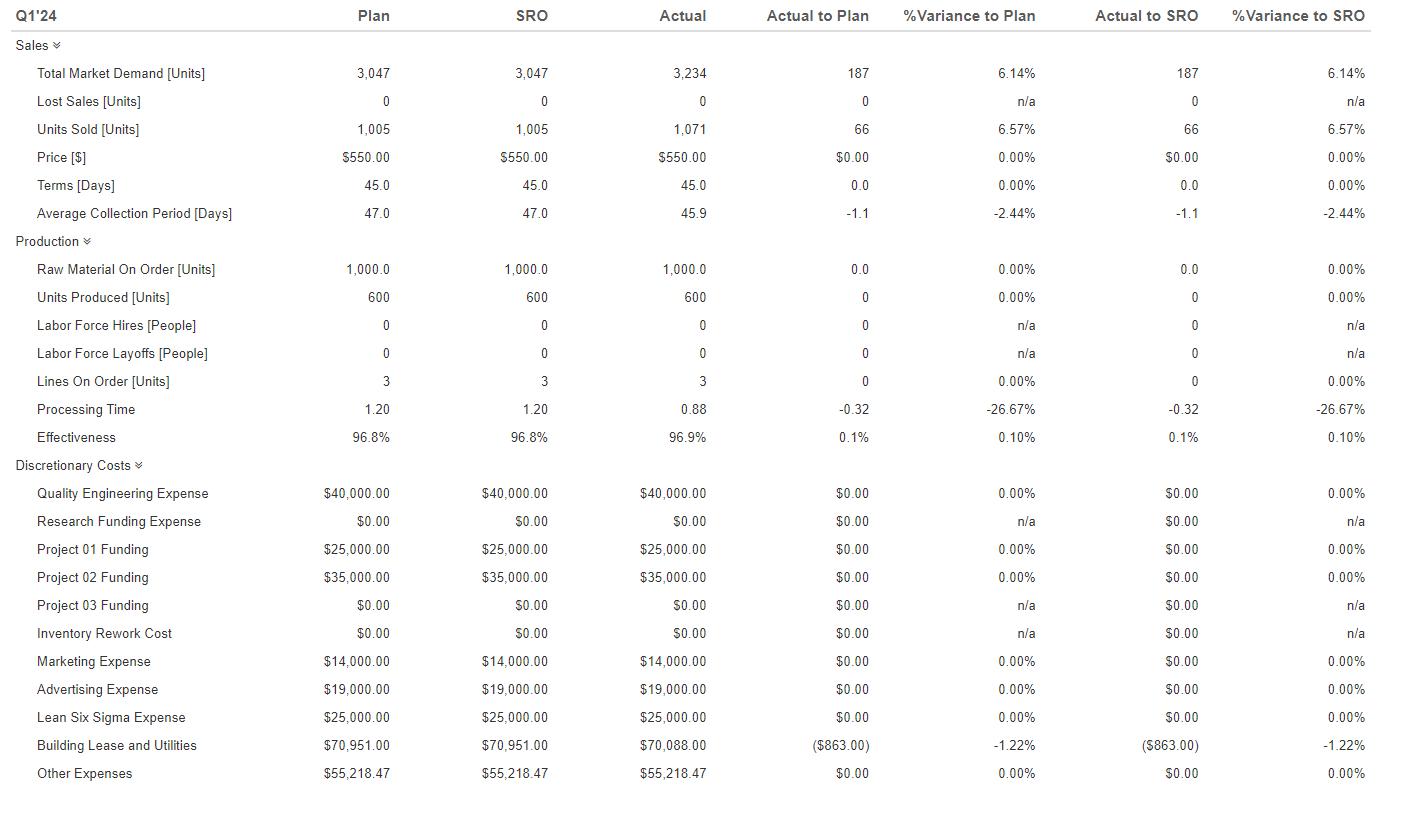
a. Using the Pre-Tax Net Income (Plan vs Actual + SRO) Walk Chart, analyze the Growth and Market Share variances and explain the key drivers. Provide data to support your analysis. b. Using the Cash Flow Walk Chart, identify two large sources/uses of cash and explain the key drivers. Provide data to support your explanations. Q1'24 Pre-tax NI Walk: Plan vs. Actual $0 $-22.7K $-45.4K $-68.1K $-90.8K $-79K $16.5K $1.2K $0 $0 $0 $2.4K $0 $-59K Pre-tax NI Walk: Plan YTD vs. Actual YTD $0 $-22.7K $-45.4K $-68.1K $-90.8K S-79K $16.5K $1.2K $0 $0 - $0 $2.4K $0 $-59K Cash Flow Walk: $0 $-115.4K $-230.9K $-346.3K $-461.7K $-372K $-29.5K $0 $26.3K $62.1K $0 $0 - $0 $-313.1K Q1'24 Sales Total Market Demand [Units] Lost Sales [Units] Units Sold [Units] Price [$] Terms [Days] Average Collection Period [Days] Production Raw Material On Order [Units] Units Produced [Units] Labor Force Hires [People] Labor Force Layoffs [People] Lines On Order [Units] Processing Time Effectiveness Discretionary Costs Quality Engineering Expense Research Funding Expense Project 01 Funding Project 02 Funding Project 03 Funding Inventory Rework Cost Marketing Expense Advertising Expense Lean Six Sigma Expense Building Lease and Utilities Other Expenses Plan 3,047 0 1,005 $550.00 45.0 47.0 1,000.0 600 0 0 3 1.20 96.8% $40,000.00 $0.00 $25,000.00 $35,000.00 $0.00 $0.00 $14,000.00 $19,000.00 $25,000.00 $70,951.00. $55,218.47 SRO 3,047 0 1,005 $550.00 45.0 47.0 1,000.0 600 0 0 3 1.20 96.8% $40,000.00 $0.00 $25,000.00 $35,000.00 $0.00 $0.00 $14,000.00 $19,000.00 $25,000.00 $70,951.00 $55,218.47 Actual 3,234 0 1,071 $550.00 45.0 45.9 1,000.0 600 0 0 3 0.88 96.9% $40,000.00 $0.00 $25,000.00 $35,000.00 $0.00 $0.00 $14,000.00 $19,000.00 $25,000.00 $70,088.00 $55,218.47 Actual to Plan 187 0 66 $0.00 0.0 -1.1 :.... 0.0 0 0 0 0 -0.32 0.1% $0.00 $0.00 $0.00 $0.00 $0.00 $0.00 $0.00 $0.00 $0.00 ($863.00) $0.00 %Variance to Plan 6.14% n/a 6.57% 0.00% 0.00% -2.44% 0.00% 0.00% n/a n/a 0.00% -26.67% 0.10% 0.00% n/a 0.00% 0.00% n/a n/a 0.00% 0.00% 0.00% -1.22% 0.00% Actual to SRO 187 0 66 $0.00 0.0 -1.1 0.0 0 0 0 0 -0.32 0.1% $0.00 $0.00 $0.00 $0.00 $0.00 $0.00 $0.00 $0.00 $0.00 ($863.00) $0.00 % Variance to SRO 6.14% n/a 6.57% 0.00% 0.00% -2.44% 0.00% 0.00% n/a n/a 0.00% -26.67% 0.10% 0.00% n/a 0.00% 0.00% n/a n/a 0.00% 0.00% 0.00% -1.22% 0.00%
Step by Step Solution
There are 3 Steps involved in it
This question appears to be a diagram related to financial analysis specifically focusin... View full answer

Get step-by-step solutions from verified subject matter experts